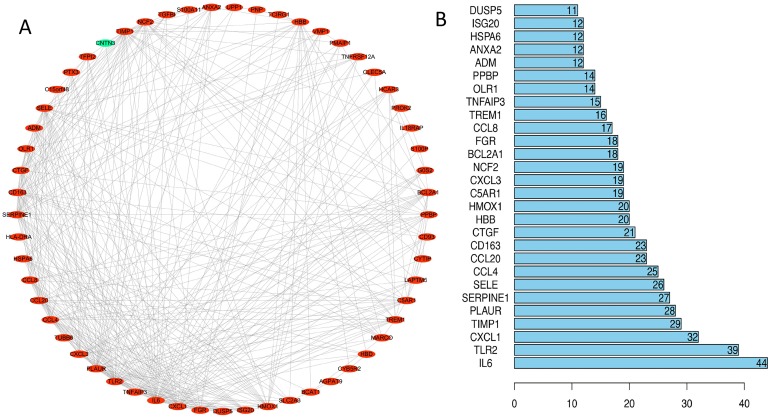
Figure 4. PPI network analysis.
(A) Using the STRING online database, a total of 57 DEGs (56 upregulated [red] and one downregulated gene [green]) were filtered into the DEG PPI network. (B) Of the DEGs with more than ten edges in the PPI network, the ten with the highest degrees of connectivity were selected as the hub genes; all are upregulated genes. Abbreviations: PPI, protein–protein interaction; DEGs, differentially expressed genes.

