



ABSTRACT
Significant amounts of soluble product aggregates were observed during low-pH viral inactivation (VI) scale-up for an IgG4 monoclonal antibody (mAb IgG4-N1), while small-scale experiments in the same condition showed negligible aggregation. Poor mixing and product exposure to low pH were identified as the root cause. To gain a mechanistic understanding of the problem, protein aggregation properties were studied by varying critical parameters including pH, hold time and protein concentration. Comprehensive biophysical characterization of product monomers and aggregates was performed using fluorescence-size-exclusion chromatography, differential scanning fluorimetry, fluorescence spectroscopy, and dynamic light scattering. Results showed IgG4-N1 partially unfolds at about pH 3.3 where the product molecules still exist largely as monomers owing to strong inter-molecular repulsions and favorable colloidal stability. In the subsequent neutralization step, however, the conformationally changed monomers are prone to aggregation due to weaker inter-molecular repulsions following the pH transition from 3.3 to 5.5. Surface charge calculations using homology modeling suggested that intra-molecular repulsions, especially between CH2 domains, may contribute to the IgG4-N1 unfolding at ≤ pH 3.3. Computational fluid dynamics (CFD) modeling was employed to simulate the conditions of pH titration to reduce the risk of aggregate formation. The low-pH zones during acid addition were characterized using CFD modeling and correlated to the condition causing severe product aggregation. The CFD tool integrated with the mAb solution properties was used to optimize the VI operating parameters for successful scale-up demonstration. Our research revealed the governing aggregation mechanism for IgG4-N1 under acidic conditions by linking its molecular properties and various process-related parameters to macroscopic aggregation phenomena. This study also provides useful insights into the cause and mitigation of low-pH-induced IgG4 aggregation in downstream VI operation.
KEYWORDS: Low pH, viral inactivation, antibody aggregation, computational fluid dynamics
Introduction
Monoclonal antibody (mAb) protein therapeutics have experienced rapid market growth in the past two decades.1–3 The purification process of mAbs typically consists of primary recovery, capture (e.g., Protein A chromatography), viral inactivation (VI) via low pH or detergent, polishing, viral filtration (VF), and ultrafiltration and diafiltration (UF/DF) steps.4 The VI unit operation is dedicated exclusively to viral reduction to meet the International Conference on Harmonization (ICH) Q5A guidance for viral safety.5 Low-pH VI, operated in either batch or continuous mode, often follows the Protein A capture step due to the acidic condition of Protein A eluate (PAE).6 A typical low-pH VI operation includes an acidification (VIA) step, where PAE is adjusted to around pH 3.6 and held for up to several hours to achieve sufficient viral inactivation,7,8 and a neutralization (VIN) step, where the VIA pool is adjusted to a pH value close to neutral for further downstream processing.9 Acidic conditions can induce product aggregation in the process stream.10–13 Therefore, establishing a procedure to effectively minimize product aggregation remains one of the major challenges of developing a robust VI process for therapeutic mAbs.14 Although mAb aggregation pathways are not fully understood, several proposed mechanisms indicate that monomers with altered secondary or tertiary structures serve as intermediates, or precursors, to the aggregation process.11,14–18 There is a growing body of evidence suggesting that these precursors initiate aggregation via exposure of hydrophobic patches that are otherwise shielded from the surface.19,20
Environmental conditions, such as pH, ionic strength, temperature, protein concentration, and excipients species/concentration, play important roles in mAb aggregation.14,21 Solution pH can affect mAb conformational and colloidal stabilities13,19,21–24 as the pH condition dictates the charge distribution on the mAb surface, and thus modulates intra-molecular and inter-molecular interactions. For example, strong intra-molecular electrostatic interactions can destabilize structure and result in partial protein unfolding.25 Inter-molecular interactions, on the other hand, are often correlated to protein colloidal stability26 and mAb aggregation propensity.27 A diffusion interaction parameter, KD, has been used to characterize mAb colloidal stability.28 KD is usually measured by dynamic light scattering (DLS) to describe the propensity for non-specific molecular association in a solution condition, where positive and negative values represent repulsive and attractive inter-molecular interactions, respectively. Ionic strength plays an important role because both positive and negative ions can interact electrostatically with proteins and potentially affect protein aggregation behaviors.23,29–32 High ionic strength can screen mAb surface charges and destabilize mAb structures, especially in low-pH conditions.33 Moreover, solution excipients or additives have been found to reduce protein aggregation propensity in solution through various mechanisms.21 For example, sugars can stabilize protein conformation and protect them from the effect of stress conditions.34 The impact of mAb concentration has also been examined, and higher concentrations are generally prone to aggregation in nature due to the higher probability of protein–protein interactions.14 Recent studies have shown the effect of the interplay between pH and protein concentration on protein conformation and protein–protein interactions for a globular protein and an IgG1 mAb.35,36 Nevertheless, very little work has been reported for other IgG subclasses (e.g., IgG4) with different low-pH stability properties in the context of low-pH VI operation.
From a process engineering perspective, insufficient mixing can generate significant pH gradients in vessels such as large-scale bioreactors,37–40 hence the need to efficiently study mixing heterogeneity using computational methods. Computational fluid dynamics (CFD) modeling has long been applied to residence time distribution (RTD) and chemical gradient calculations for reactors and mixers in various application areas.41–47 Very little research, if any, has been done using CFD modeling to solve challenges encountered in low-pH VI process for mAbs, where product aggregation is still largely explored by empirical and experimental methods.
Here, we decoupled the VIA and VIN steps to gain a fundamental understanding of their individual contributions to mAb aggregation during VI. The effects of pH, hold time, and protein concentration were investigated using various characterization techniques. IgG4-N1 unfolding under low-pH conditions was explored, and its conformational and colloidal stabilities were examined. These biophysical properties were used to facilitate the understanding of the aggregation kinetics analyzed using a model with characteristic parameters.48 Independent variables, as well as the complex interplay between the factors, were investigated together with the mAb surface charge calculations by homology modeling to study possible aggregation mechanism in low-pH VI using a systematic study approach. Moreover, we used CFD modeling to provide a quantitative measure of acid distribution in the confined geometry of mixing vessels, where factors such as agitation speed, titrant addition rate, and protein concentration were taken into consideration. This tool was used to quantify and minimize the localization of extreme pH zones, especially for large-scale VI operation, to reduce the mAb aggregation risk.
Results
Product aggregation observed in original scale-up run
The VI of a scale-up run for IgG4-N1 was performed using a SUM-100 mixer containing 66.5 L of PAE (28 g/L, pH 4.6) with a 50 rpm impeller agitation speed. The pH was lowered to 3.6 during the VIA step by adding 0.1 N HCl at a rate of 2.62 L/h/L, achieving an acid (stock solution) mass fraction of 0.12. The VIA pool was held for 60 min at room temperature followed by neutralization (i.e., VIN) to pH 5.5 with 2 M Tris at a rate of 0.46 L/h/L, achieving a base (stock solution) mass fraction of 0.0106. As shown in Table 1, the high molecular weight (HMW) aggregate levels of the VIA and VIN pools were 1.7% and 7.1%, respectively. The aggregate amount in the VIN pool exceeded the level specified for in-process control and led to lot rejection of the final drug substance produced.
Table 1.
Product aggregation in scale-up and bench scale VI runs.
| Scalea | Scale-up | Bench | ||
|---|---|---|---|---|
| Vessel | SUM-100 | Glass Beaker | ||
| Maximum Volume | 100 L | 50 mL | ||
| PAE volume | 66.5 L | 25 mL | ||
| VIA pH | 3.6 | 3.6 | ||
| VIN pH | 5.5 | 5.5 | ||
| Mixing | Yes | Yes | Nob | |
| VIA pool HMW | 1.7% | 1.3% | 3.5% | |
| VIN pool HMW | 7.1% | 2.4% | 13.0% | |
aStarting material was a PAE at a concentration of 28 g/L and HMW of 1.2%.
bAcid titrant was added with no stir bar mixing, followed by a static hold of the VIA pool for 5 min.
Bench scale VI runs
Bench scale VI runs were performed to mimic the scale-up conditions. The same acid and base mass fractions as those for the scale-up run were used in small 50 mL beakers with sufficient mixing achieved using a magnetic stir bar. As shown in Table 1, the HMW levels of the bench scale VIA and VIN pools were 1.3% and 2.4%, respectively, thus the significant aggregate formation during VIN appeared scale dependent. As the scale-up SUM-100 mixer uses a top-mounted impeller, the mixing condition between the two scales may contribute to the difference in the degree of product aggregation that showed up only during the technology transfer for large-scale operation. To test this, a second bench scale run was performed without stirring during acid titration, and the VIA pool was left undisturbed for 5 min prior to the start of stirring (see details in Materials and Methods). As a result, the HMW levels of the VIA and VIN pools increased from 1.3% to 3.5% and from 2.4% to 13.0%, respectively. To gain a mechanistic understanding of the key factors contributing to product aggregation, the molecular properties of IgG4-N1 in relevant solution conditions were further studied.
Impact of pH
The impact of VIA pH on IgG4-N1 aggregation was studied between pH 3.0 and 3.8, covering the specified target for the VIA step with a broader acidic range. Following acid titration and hold, the samples were titrated to pH 5.5 (unless noted otherwise) and then held for 20 h or more prior to further characterization. The VIN samples at pH 5.5 were tested to evaluate the aggregation behavior after the exposure of IgG4-N1 to various VIA pH conditions because VIN is a standard VI sampling point and the mAb displays good solution stability at this pH. The HMW levels of pH 5.5 VIN samples typically reached a plateau approximately 20 h after the VIN pH adjustment (discussed below), hence samples were stored overnight prior to evaluation by size exclusion chromatography (SEC) (see Supplement S1). At lower VIA pH (Figure 1a), the HMW levels of VIN samples increased nonlinearly from 1.6% (at pH 3.8) to approximately 70% (at pH 3.0), suggesting that lower pH (3.3 to 3.0) causes significant IgG4-N1 aggregation.
Figure 1.
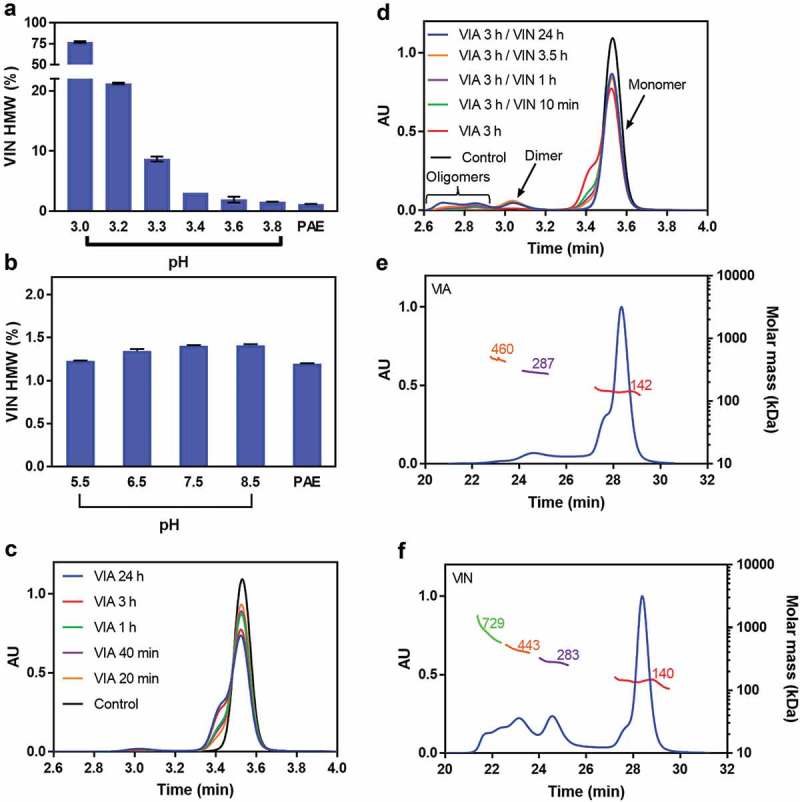
pH impact on IgG4-N1 aggregation. (a) Product HMW levels at VIA pH 3.0–3.8. PAE was adjusted to target VIA pH conditions and held for 1 h, then neutralized to pH 5.5, and tested for SEC after overnight equilibration. (b) Product HMW levels at pH 5.5–8.5. PAE was directly adjusted to target VIN pH conditions, and tested for SEC after overnight equilibration. (c) SEC chromatogram overlay for VIA samples at pH 3.3 with various hold times. The VIA samples were tested for SEC without pH neutralization. (d) SEC chromatogram overlay for VIN samples at pH 5.5 with various hold times. The 3 h hold VIA sample at pH 3.3 was neutralized to pH 5.5 and then held for various periods; the control sample was the PAE at pH 4.6 without pH adjustment. (e) SEC-MALS data for a VIA sample (pH 3.3 with 3 h hold). (f) SEC-MALS data for a VIN sample (VIA at pH 3.3 with 3 h hold, then neutralized to pH 5.5 with 3.5 h hold). The error bars in (a) and (b) represent standard deviation of duplicate experiments.
The impact of VIN pH was studied between pH 5.5 and 8.5, covering the specified target for the VIN step with a broader basic range. The upper limit of pH 8.5 was used because higher pH requires a large amount of base addition and significant sample dilution, as illustrated by the titration curve (see Supplemental S2). In addition, directly adjusting the PAE material to VIN pH conditions had very little effect on HMW levels (Figure 1b). These results demonstrate the stable property of IgG4-N1 in the VIN conditions tested and reveal the essential role of acidification (i.e., VIA) in causing product aggregation during low-pH VI.
Impact of hold time
An IgG4-N1 PAE material was adjusted to pH 3.3, held at room temperature for various durations (from 20 min to 24 h) prior to evaluation by SEC to measure HMW levels. As shown in Figure 1c, noticeable front shoulder on the monomer SEC chromatogram was observed when VIA samples were directly evaluated by SEC without pH neutralization, and the magnitude of the shoulder increased proportionally with VIA hold time. SEC-multi-angle light scattering (MALS) data (Figure 1e, f) indicated that the species corresponding to the front shoulder were of the same molecular weight as native monomers, and thus were likely the partially unfolded species with larger hydrodynamic radii. To investigate the impact of VIN hold time, a VIA sample held for 3 h was neutralized to pH 5.5 and held at room temperature for various durations (from 10 min to 24 h) prior to evaluation by SEC. In Figure 1d, the front shoulder observed at pH 3.3 decreased with increasing VIN hold time and eventually disappeared after 24 h with a concomitant increase in higher order aggregates. Thus, the “shoulder” peak appeared to have become aggregates of various sizes.
Interactive effect of pH, hold time, and protein concentration
The interplay between VIA pH, hold time, and protein concentration on IgG4-N1 aggregation was evaluated using a full factorial design-of-experiments study (see Supplement S3) designed using JMP® software (SAS Institute Inc., version 13). To help in this evaluation, the aggregation rate constant (k value) was obtained by fitting the monomer fraction of the kinetics experiments using an exponential monomer decay equation (Equation 1). As shown in Figure 2a, lower protein concentration yielded lower aggregation potential since the effect of protein concentration on IgG4-N1 aggregation was more pronounced at lower pH. The plots in Figures 2b and c show the relative aggregate and monomer content, respectively, for pH 5.5 VIN samples that were initially subject to low VIA pH (3.0–3.6) at a protein concentration of 30.0 g/L. The contour plot in Figure 2d summarizes the data fitted to Equation 1. Results indicated that k increased in a nonlinear manner with decreasing VIA pH (a deflection point was observed at approximately pH 3.3), and further increased with protein concentration. The calculated monomer and HMW values from the fitted curves were in good agreement with the experimental data in the conditions examined here (data not shown). Thus, the model-fitted k values allowed a comprehensive comparison between different VI conditions and provided a quantitative assessment of aggregation propensity without experimentally testing each individual condition. For example, in Figure 2e and f, the contour plots of “HMW% at 5 min” and “HMW% at plateau” demonstrated the significant impact of VIA hold time on the HMW levels in the VIN samples due to product aggregation kinetics that is strongly dependent on pH.
Figure 2.

Impact of VIA pH and protein concentration on IgG4-N1 aggregation behaviors. (a) HMW levels of VIN samples with 1 h hold in various VIA pH and protein concentration conditions. (b) Aggregation kinetics measured for VIN samples in various VIA pH conditions at 30 g/L. (c) Monomer levels of the same samples as those shown in (b), with regression lines obtained using the exponential monomer decay equation (Equation 1). (d) Contour plot of rate constant k fitted using Equation 1. (e) Calculated contour plot of VIN HMW levels with VIA samples held for 5 min. (F) Calculated contour plot of plateau HMW levels in VIN samples as derived using Equation 1. All VIN samples in (A)-(F) were adjusted to pH 5.5. The error bars in (A) represent standard deviation of duplicate experiments.
Conformational stability of IgG4-N1 in various VI conditions
The conformational stability of IgG4-N1 was characterized by comparing its thermal stability in various solution conditions using differential scanning fluorimetry (DSF). The relative apparent protein hydrophobicity of VIA and VIN samples was explored using fluorescence spectroscopy and fluorescence-SEC.
DSF was utilized to measure the melting temperature (Tm) of IgG4-N1 from pH 3.3 to 9.0. As shown in Table 2, Tm increased with increasing pH until an inflection point at approximately pH 7.0, beyond which Tm started decreasing. The lowest Tm value was observed at the lowest pH of the range tested, thus indicating a correlation between extreme acidic solution environments, mAb thermal stability, conformational stability, and aggregation propensity.49,50 The Tm values provided a quantitative measure for comparing the conformational stability of IgG4-N1 in different solution conditions.
Table 2.
Tm values of IgG4-N1 in various pH conditions.
| pH | 3.3 | 3.6 | 4.6 | 5.5 | 6.0 | 7.0 | 8.0 | 9.0 |
|---|---|---|---|---|---|---|---|---|
| Tma (°C) | 34.3 ± 0.1 | 38.6 ± 0.8 | 49.2 ± 0.1 | 53.7 ± 0.5 | 63.2 ± 0.1 | 67.0 ± 0.0 | 64.8 ± 4.0 | 58.6 ± 0.1 |
aProtein concentrations for all samples were 5 g/L. Tm values are average of three measurements, with the errors representing standard deviation.
Further studies using fluorescence spectroscopy and fluorescence-SEC were performed to better understand specific IgG4-N1 characteristics (e.g., hydrophobicity) associated with its conformational stability in relevant solution conditions. As protein unfolding is typically accompanied by the exposure of hydrophobic patches, the IgG4-N1 structure was analyzed by fluorescence spectroscopy with a fluorescent dye (Sypro Orange) to measure potential surface hydrophobicity changes in response to varying VIA and VIN pH conditions. As shown in Figure 3a, the maximum fluorescence intensity of VIA samples increased over time during VIA hold (from 10 min to 3 h), suggesting an unfolding process of IgG4-N1 into a form that has increased surface hydrophobicity at pH 3.3 (Figure 1c). The HMW levels of these samples largely remained unchanged within the duration studied. In contrast, as shown in Figure 3b, the maximum fluorescence intensity of VIN samples decreased over the time course studied, suggesting a gradual refolding process into a form that is less hydrophobic at pH 5.5.
Figure 3.

Fluorescence intensity of IgG4-N1 VIA and VIN samples with various hold times. All samples except the buffer control had the same protein concentration. The excitation wavelength of Sypro Orange was 490 nm, with emission scanned from 500 nm to 700 nm. (a) VIA samples held at pH 3.3 for various times (10 min-3 h) before adding Sypro Orange for measurements by fluorescence spectroscopy. (b) VIN samples (from VIA at pH 3.3 held for 1 h) held at pH 5.5 for various times (0 min-48 h) before adding Sypro Orange.
The size of the species with enhanced surface hydrophobicity was characterized by fluorescence-SEC to explore the molecular impact of the protein unfolding. As shown in Figure 4a, the fluorescence peak maximum (approximately 8.25 min) of the pH 3.3 VIA samples was significantly higher than that for the pre-pH adjusted (i.e., PAE eluate) sample used, even for VIA samples incubated for only 10 min. The fluorescence peaks further increased over time and largely overlapped with the front shoulder of the monomer peaks on the UV 280 chromatogram (Figure 4b). In contrast, the fluorescence intensity of monomer peaks decreased significantly in the VIN samples (Figure 4c) for which the mass injection was the same as that used in Figure 4a, as indicated by the UV 280 chromatogram (Figure 4d). These results suggest that IgG4-N1 monomers at least partly unfold at pH 3.3 and remain as monomers until the pH is neutralized. At this point, the refolding process of the partially unfolded and relatively hydrophobic monomers takes place, and this is accompanied by the increase in HMW levels. Note that refolding continues slowly for many hours during the VIN hold, which leads to the formation of higher-order aggregates, as suggested in Figures 4c and d and in Figure 1d. It should be noted that our intention in discussing folding/unfolding status here was to qualitatively or semi-quantitatively compare the overall conformational changes of IgG4-N1 in various pH conditions. Investigation of the molecular folding/unfolding pattern was beyond the scope of this work but could provide a more detailed insight into the impact of altered monomer structures on aggregate formation.
Figure 4.

Inline fluorescence SEC data for VIA and VIN samples with various hold times. Sypro Orange signal was collected for excitation at 490 nm and emission at 574 nm. (a) Inline fluorescence overlay of VIA samples at pH 3.3 with various hold times (10 min-3 h). Peak maxima correspond to 8.25 min retention time, shown as vertical dotted line. (b) UV 280 nm signal overlay of the same samples in (a). (c) Fluorescence signal overlay of VIN sample at pH 5.5 with various hold times (10 min-24 h), using a VIA pool held at pH 3.3 for 1 h. (d) UV 280 nm signal overlay of the same samples in (c).
Colloidal stability of IgG4-N1 in various VI conditions
Diffusion interaction parameter KD values were obtained by DLS data analysis using Equation 2 and linked to the colloidal stability of IgG4-N1 in various pH conditions. Higher KD values indicate better colloidal stability. Data showed that the KD value (0.191 ± 0.002 mL/mg) of the VIA sample at pH 3.3 is more than 6-fold higher than that for the PAE control at pH 4.6 (0.032 ± 0.004 mL/mg), and nearly 10-fold higher than that for the VIN sample at pH 5.5 (0.021 ± 0.001 mL/mg). The better colloidal stability of IgG4-N1 at low pH may be due to stronger inter-molecular repulsions that prevent the partially unfolded monomers from being readily associated with each other. The lower colloidal stability in VIN conditions is due probably to weaker inter-molecular repulsions leading to much easier association of the unfolded monomers prior to the completion of the refolding process in the VIN step.
Homology modeling and surface charge
Homology model of IgG4-N1 and its charge were calculated as described in the methods section to better understand molecular interactions, especially at low pH. As shown in Figure 5a, with decreasing pH, the net charge (positive charge minus negative charge) increases as expected, while the total charge (positive charge plus negative charge) decreases. The net and total charge properties at lower pH contribute to repulsive electrostatic interactions, leading to hindrance to monomer association and relatively good colloidal stability as discussed earlier. However, the intra-molecular repulsions inevitably affect the balance of electrostatic, van der Waals and hydrogen bonding forces that maintain protein native structure, which explains the lower conformational stability at lower pH.
Figure 5.
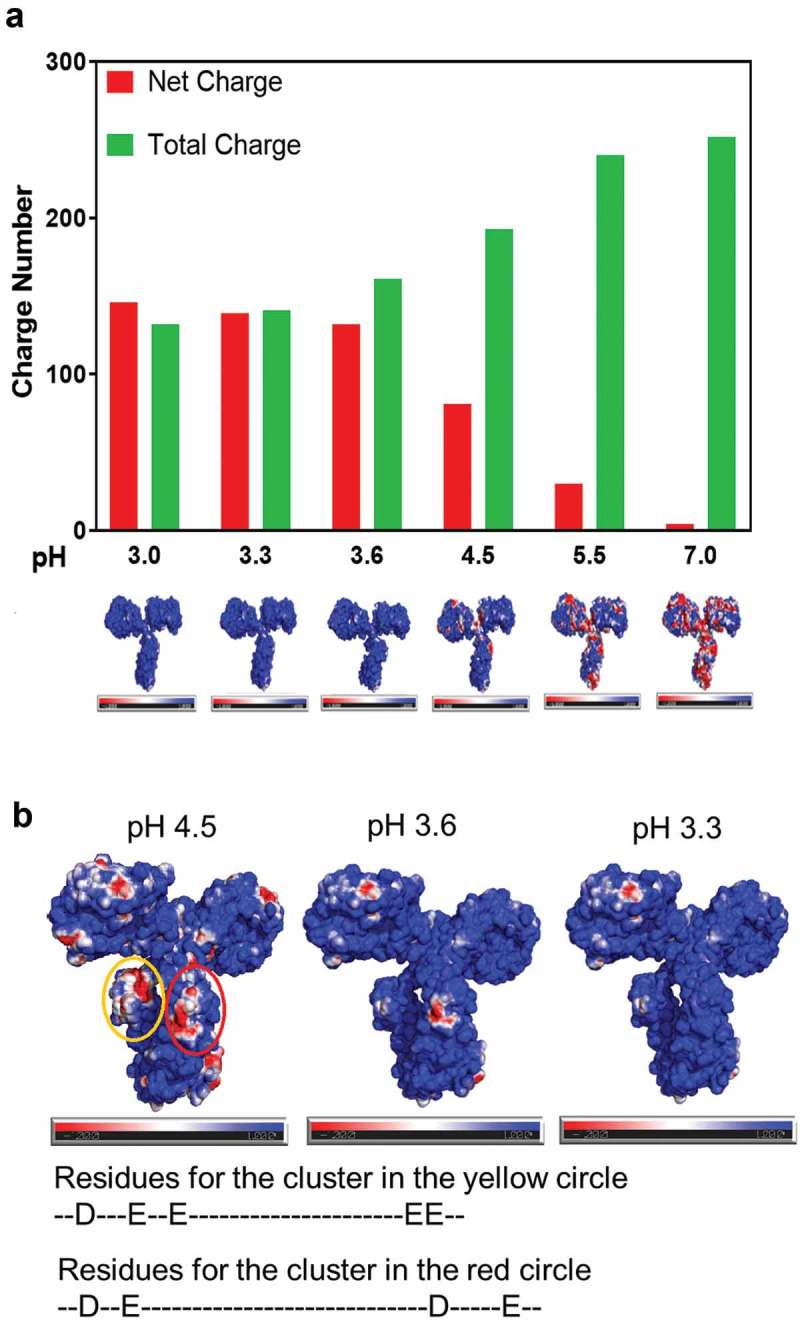
Charge property of IgG4-N1 by homology modeling in various solution pH conditions. (a) Net and total charge at pH 3.0–7.0, with the corresponding surface charge distribution where positive, negative, and neutral charges are shown in blue, red, and white, respectively. (b) Comparison of the surface charge distribution at pH 4.5, 3.6 and pH 3.3, where negatively charged clusters at pH 4.5 (in CH2) are circled in yellow and red, with the corresponding contributing amino acid residues.
The surface charge distribution of IgG4-N1 was calculated to further study the molecular stability from pH 4.5 to 3.3, where several clusters experience charge property changes (Figure 5b). As the clusters in the complementarity-determining region, CH1, and CH3 domains are facing outwards, their charge properties are likely to contribute to the colloidal stability of IgG4-N1 at low pH through repulsive protein–protein interactions. With respect to conformational stability, two charge clusters in CH2 domains are noticeably in close proximity and may affect the IgG4-N1 structure at lower pH, possibly involving two acidic residues, aspartic acid (denoted as “D”) and glutamic acid (denoted as “E”) in these regions.
Aggregation mitigation using excipients
As shown in Figure 6, several buffer components and excipients were evaluated for their impact on conformational stability and aggregation propensity of IgG4-N1. For example, adding 10% (w/v) mannitol to the VIA buffer matrix indeed resulted in a 4.2-fold decrease in the aggregation rate constant compared to that for the control condition. Correspondingly, IgG4-N1 showed a moderately increased Tm (38.9 ± 0.3°C) compared to that (34.3 ± 0.1°C) of the control condition. The results demonstrate that protein stability modifiers such as mannitol can effectively reduce aggregation formation in low-pH VI. This protein stabilizing effect of mannitol agrees well with other reports.51,52
Figure 6.
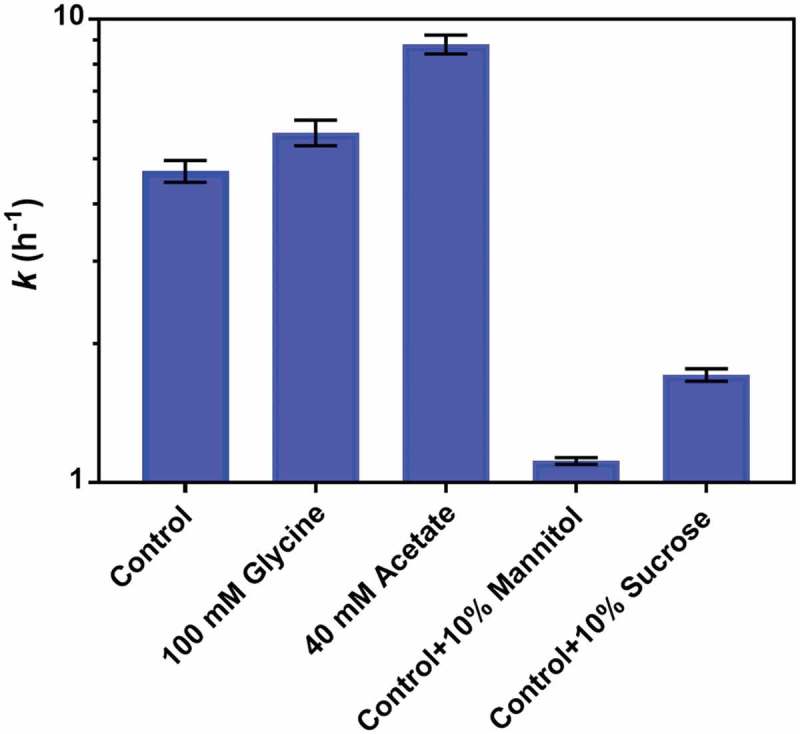
Effect of buffer components and excipient on the acid-induced aggregation of IgG4-N1. The aggregation rate constants, k values, are plotted on a log-10 scale in various solution conditions at pH 3.0 and 5.0 g/L (for VIA). The control sample is in 25 mM glycine and 10 mM succinate, with the excipient ratios for the other samples in w/v. The error bars represent standard deviation of duplicate experiments.
CFD-assisted aggregation mitigation strategy
A CFD modeling tool was developed to simulate the dynamic change of pH distribution over time within the VI vessel during acid titration. This computer-assisted approach provides an effective measure for reducing the aggregation risk caused by insufficient mixing in scale-up operation. As shown in Figure 7, the localized low-pH zone during acid addition is illustrated by the iso-surface of pH 3.3 that was set based on the measured aggregation properties of IgG4-N1. The pH within the iso-surface is below 3.3, and that outside the iso-surface is above 3.3. The acid addition inlet (at pH 1.0) is at the liquid surface in the center of the highlighted low-pH area. Using the process parameters for SUM-100 Run 1 (the original scale-up run), the iso-surface area is increased by approximately 14-fold (from 0.0024 m2 to 0.033 m2) from 1 s to 192 s after the start of acid addition (Figure 7a). The size of the localized low-pH zone depends on the mixing parameters used and directly reflects the risk of product aggregation during acid titration.
Figure 7.
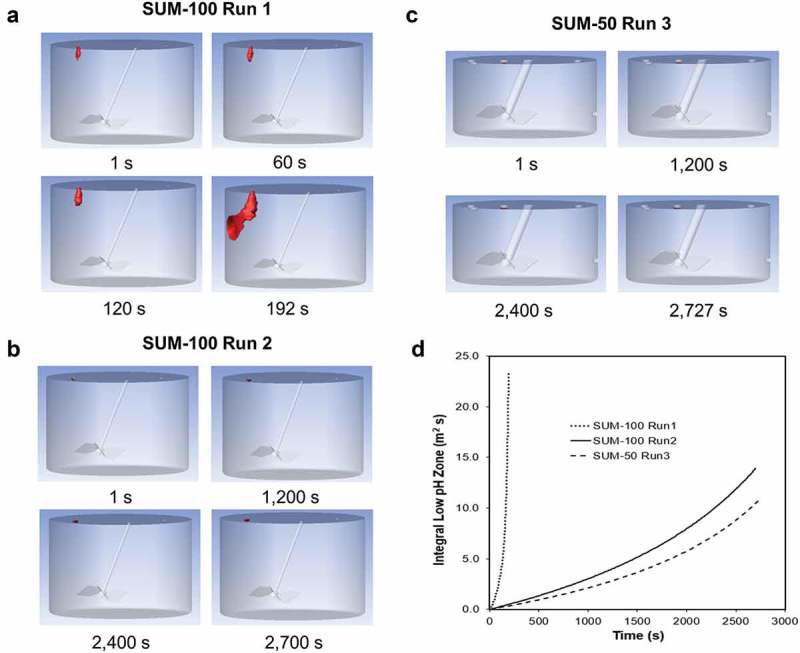
SUM run mixing conditions simulated by CFD. (a) SUM-100 Run 1 in non-optimized mixing condition. (b) SUM-100 Run 2 in optimized mixing condition. (c) SUM-50 Run 3 in optimized mixing condition. (d) Integral Low-pH Zone (m3 s) of the three runs as a function of time in seconds (s). Localized low-pH region (≤pH 3.3) in (a), (b), and (c) is shown in red.
The localized low-pH zone was minimized using CFD modeling to obtain optimal VI operating parameters, including acid addition rate, mixing duration, and agitation speed. As shown in Table 3, a slower acid addition rate of 0.1 L/h/L, an extended mixing duration of 2700 s, and a higher agitation speed (in terms of power per unit volume, P/V) of 3.5 W/m3 (vs. 2.6 L/h/L, 192 s, 1.2 W/m3 for SUM-100 Run 1, respectively) were recommended for SUM-100 Run 2 and SUM-50 Run 3. Under the new operating condition, the calculated iso-surface area is effectively controlled and only increased by approximately 2-fold (from 0.00045 m2 to 0.00096 m2 for Run 2, and from 0.00030 m2 to 0.00067 m2 for Run 3) from the beginning to the end of the acid titration process, as visualized in Figures 7b and c.
Table 3.
Parameters and performance of VI operation in SUM-100 and SUM-50 mixers.
| Parameters | SUM-100 Run 1 |
SUM-100 Run 2 |
SUM-50 Run 3 |
|
|---|---|---|---|---|
| Experimental | Protein Concentration (g/L) | 28 | 23 | 24 |
| Initial Volume (L) | 66.5 | 60.7 | 25.3 | |
| Agitation (RPM) | 50 | 70 | 59 | |
| Agitator P/V Ratio (W/m3) | 1.17 | 3.52 | 3.59 | |
| Initial pH | 4.6 | 4.5 | 4.4 | |
| 0.1N HCl Volume (L) | 9.3 | 4.7 | 2.4 | |
| 0.1N HCl Feed Rate (L/h) | 174.0 | 6.2 | 3.1 | |
| Relative 0.1N HCl Feed Rate (L/h/L) | 2.62 | 0.10 | 0.12 | |
| End pH | 3.6 | 3.8 | 3.8 | |
| Duration (min) | 3.2 | 45.2 | 45.5 | |
| Experimental End Mass Fraction | 0.122 | 0.071 | 0.084 | |
| VIN Pool HMW (%) | 7.1 | 1.8 | 1.3 | |
| CFD | Simulated End Mass Fraction | 0.122 | 0.065 | 0.083 |
| End pH 3.3 Iso-Surface (m2) | 0.0330 | 0.00096 | 0.00067 | |
| Integral low pH zone (m3 s) | 2.92 | 0.36 | 0.23 |
It should be noted that a lump-sum output parameter, termed here as Integral Low pH Zone (ILPZ), was defined (Equation 3) to quantify the combined effect of iso-surface area, mixing duration, and protein concentration on IgG4-N1 aggregation. This output takes into consideration the critical factors identified experimentally as a characteristic measure for aggregation risk. Results suggest that ILPZ value is positively correlated with the aggregate formation in various VI operating conditions. As shown in Figure 7d, ILPZ value of SUM-100 Run 1 reached 2.92 m3 s, while that of SUM-100 Run 2 and SUM-50 Run 3 only reached 0.36 m3 s and 0.23 m3 s, respectively. Consistently, the product aggregate levels of Run 1, Run 2 and Run 3 were 7.1%, 1.8%, and 1.3%, respectively, showing ILPZ is an effective model parameter for optimizing and estimating VI process performance.
Discussion
As shown by experiments and CFD modeling, poor mixing conditions can lead to the formation of low-pH zones throughout the entire acid titration process and cause severe product aggregation during VIA. Although product aggregates are formed mainly in the VIN step, their levels are actually dictated by the aggregation kinetics in these low-pH zones where the pH (≤3.3) can be significantly lower than the target VIA pH (approximately pH 3.6). The data collected here show that the aggregation propensity of IgG4-N1 is insignificant at pH 3.6–8.5, whereas aggregation kinetics are much faster at pH 3.0–3.3.
It has been reported that the aggregation rate constant is largely independent of protein concentration.48,53 However, the IgG4-N1 concentration at low pH was shown to have a significant impact on both aggregation kinetics and the aggregation rate constant. This may be attributable to the relatively low protein concentration (0.5–4 mg/mL) and high pH (pH >3.6) conditions of the previous study.53 In our work, a weak dependence of the aggregation rate constant on protein concentrations (7.5–30 g/L) was seen between pH 3.3–3.6, but this dependence became more obvious when the pH was lowered further, and a much stronger dependence was observed between pH 3.0–3.3 (Figure 2d). The characteristics of the aggregation kinetics for IgG4-N1 indicate a complex underlying mechanism that is governed by the molecular properties and their impact on the molecular interactions at low pH. Protein concentration can modulate the inter-molecular interactions (e.g., electrostatic, van der Waals forces and hydrophobic interactions).28,54 High protein concentrations leading to high aggregation rates appear to be linked to IgG4-N1 structural stability (Supplemental S4), which is possibly affected by a subtle balance between intra-molecular interactions and molecular crowding effects. This work emphasizes the practical need for mechanistic studies on product aggregation in low-pH VI operation, as high-concentration PAE is becoming an industry trend due to wide adoption of high-capacity protein A resins and technology advances in process intensification.
The low-pH exposure (≤3.3) of IgG4-N1 even for a few minutes can cause structural changes to the monomer species that serve as nuclei for promoting aggregate formation once VIN is performed. In the VIN step, refolding of the conformationally altered monomers is a parallel pathway competing with the aggregation process, depending on the solution condition and relative energetic favorability between these two pathways.55 Given that the refolding process usually needs to overcome a substantial energy barrier,20,49,56,57 complete refolding is likely to take a much longer time than rapid aggregation and the processing time of a typical VIN procedure (approximately 1 h). Thus, the following is proposed to describe the molecular behaviors of the low-pH VI operation for IgG4-N1. In the VIA step, the low-pH condition promotes strong intra-molecular repulsions leading to partial monomer unfolding characterized by an increase in surface hydrophobicity. These unfolded species are larger than native monomer and appear as a front shoulder of the monomer peak by SEC. On the other hand, the strong charge repulsion of these monomers promotes colloidal stability and prevents aggregate formation. During the VIN titration and hold, the repulsive charge on the protein is reduced at the relatively neutral pH, decreasing the colloidal stability and facilitating product aggregation through inter-molecular interactions. Meanwhile, the intra-molecular interactions become favorable, allowing the unfolded monomers to gradually gain the native folded structure displaying reduced surface hydrophobicity.
The homology modeling of IgG4-N1 was generated from a full-size IgG4 molecule crystallized in a specific buffer that is different from the VIA and VIN solution compositions studied. Caution should thus be taken when interpreting the tertiary structure model and calculated surface charge distribution for IgG4-N1. It should also be noted that molecular interactions are likely more complex than the approach described here, which used only electrostatic charge calculations and assumed no unfolding is taking place. Nevertheless, our results provide a qualitative perspective of molecular interactions in VI operation where IgG4-N1 conformational changes are relatively minor and in local surface regions affecting the formation of soluble aggregates, unlike extreme acidic conditions that often lead to product denaturation and substantial precipitation. Visualization and analysis of electrostatic interactions at the level of amino acid compositions may shed light on mAb designs for desired low-pH stability and manufacturability. A detailed calculation of IgG4-N1 structural changes in the low-pH conditions examined is outside the scope of this work but can be achieved using molecular dynamics simulations58,59 where further research may prove insightful.
To the best of our knowledge, this work demonstrates the first application of CFD modeling in the published literature to address the scale-up challenges of low-pH VI operation, where localized pH zones are associated quantitatively to product aggregation in large impeller-driven mixing vessels. The VI operating parameters were optimized computationally with a CFD model that is fully integrated with titration and aggregation kinetics measurements. Furthermore, a generic method was developed to use the iso-surface of which the critical pH (3.3 for IgG4-N1) is determined empirically for a given mAb product and relevant solution conditions. For this work, IgG4-N1 aggregation is primarily attributed to the heterogeneous mixing conditions during acid titration. The features (e.g., size, duration) of the low-pH zones reflect the mixing nonideality that is typically negligible when using small-scale mixing devices but requires extra attention when using large-scale systems.
Materials and methods
Materials
The mAb (IgG4-N1) used in this study was a proprietary engineered IgG4 from Bristol-Myers Squibb Company and produced from a Chinese hamster ovary cell culture process. IgG4-N1 has a molecular weight (MW) of 140–150 kDa and a slightly basic pI. The starting PAE materials (22–28 g/L) were in buffer 25 mM glycine, 10 mM succinic acid at pH 4.6 and contained 99% of monomer. PAE samples at different concentrations were prepared by diluting a stock PAE material (55 g/L) that was concentrated using a PALL Omega™ membrane (OS030T02). Product monomer purity was confirmed after the concentration step. Different buffer matrices for PAE were achieved by exchanging the starting PAE material to corresponding solution conditions by ultrafiltration/diafiltration using a PALL Omega™ membrane (OS030T02) on a PendoTECH TFF process system (PendoTECH, PDKT-PCS-TFF). Chemicals were purchased from Thermal Scientific. All experiments were performed at room temperature of 20–23°C.
Bench scale VI study
Bench mixing study was performed in a 50 mL glass beaker (VWR, 10754–948) with a stir bar (VMR, 58948–138) on a stirrer station (Corning, PC-210). The initial working volume was 25 mL of PAE (28 g/L). Acid (0.1 N HCl) and base (2 M Tris) titrants were added in a dropwise manner within 2 min with the stir setting at 5 to 6 (equivalent to 250–300 rpm). In the VIA step, 0.1 N HCl was added to PAE to reach pH 3.6. The acidified PAE was held for 60 min (unless noted otherwise for some conditions). In the following VIN step, 2 M Tris was added into the VIA sample to reach pH 5.4–5.7 (target 5.5) using the same mixing condition. The VIN sample was then held for 15 min before 0.2 µm filtration. For the no mixing condition (in Table 1), acid titrant was added to 25 mL PAE sample without mixing and the VIA sample was kept undisturbed for 5 min before normal mixing resumed. The final VI pH was confirmed to achieve the desired target. The rest of the VI procedure for the no mixing condition was the same as the normal condition described above.
Other experiments were performed in 1.5 mL Eppendorf tubes (Eppendorf AG, 022363204). The ratios of 0.1 N HCl and 2 M Tris for different pH targets were pre-determined. Each pH-adjusted sample was mixed thoroughly by inverting the tube 5–7 times or pipetting up and down 5–7 times upon titrant addition. Protein concentration was adjusted with corresponding solution of the same pH, as needed.
Scale-up VI study
The scale-up VI operation was performed using SUM-100 (Thermal Scientific, SH3B10537.01) and SUM-50 (Thermal Scientific, SH3B10534.01) mixing bags. The impeller with a power number of 2.1 was top mounted and inserted into solution at a 15° angle from the vertical position, mixing in a down-pumping mode. Acid and base titrants were pumped through corresponding ports on the bag, with a pH probe (Mettler-Toledo, Inpro 325X(i)) installed on the side close to the bottom to record real-time pH values. The titrants addition rates and agitation speed are listed in Table 3.
Size exclusion chromatography
Soluble product aggregates were analyzed on a Waters UPLC system (Waters, Acquity H-Class PLUS) with UV detection at 280 nm, using an Acquity UPLC protein BEH SEC column (Waters, 125 Å, 1.7 µm, 4.6 mm×150 mm) and an Acquity UPLC protein BEH guard column (Waters, 4.6 mm × 30 mm). All samples were 0.2 µm filtered to remove potential large particles prior to applying a total mass of 50 µg protein to the SEC-UPLC system. The mobile phase (200 mM sodium phosphate, 150 mM sodium chloride, pH 6.8) was run at a flow rate of 0.4 mL/min. Data were analyzed using Waters Empower 3 chromatography data system software (Waters, version 3).
Fluorescence-size exclusion chromatography
A modified SEC-HPLC instrument (Fluorescence-SEC) was used to detect the hydrophobicity of IgG4-N1 samples, on a Waters Alliance e2695 separation module with a TSKgel G3000SWXL column (Tosoh Corporation). A total injection mass of 100 µg protein for each sample was applied to the SEC-HPLC system. The mobile phase (200 mM sodium phosphate, 150 mM sodium chloride pH 6.8) was spiked with 2000x of Sypro Orange (Invitrogen, S6650, lot#1859363, 5000x). The UV signal was detected at 280 nm with a Waters 2487 dual λ absorbance detector, and fluorescence signal was detected at the excitation wavelength of 490 nm and emission wavelength of 574 nm with a Waters 2475 multi λ fluorescence detector.
Size exclusion chromatography multi-angle light scattering (SEC-MALS)
SEC-MALS was performed on a Waters Alliance e2695 HPLC system and miniDAWN TREOS detector (Wyatt Technology). The molecular weight of the protein peaks was calculated with the Astra software version 7.1.3 (Wyatt Technology).
Aggregation kinetics analysis
Monomer percentage loss as a function of time was used to describe IgG4-N1 aggregation kinetics at various pH levels and protein concentrations. Equation 1 is used for data analysis.
where y0 is the monomer plateau value (total monomer percentage remained at equilibrium), A is the value of total monomer lost that is equal to initial monomer level minus plateau monomer level, k is the rate constant (h−1) and x is incubation time (h).48
Fluorescence spectroscopy
Steady-state fluorescence spectroscopy was performed on a Cary Eclipse fluorescence spectrophotometer (Agilent Technologies, G9800A) with 96-well plates where a sample volume of 100 µL per well (n = 3) was used before 1000x of Sypro Orange was added to each well. The excitation was at 495 nm with emission scanned from 500 nm to 700 nm. Each sample was tested in triplicate and the data were analyzed with GraphPad Prism 7 software (GraphPad Software).
KD measurement
Diffusion interaction parameter (KD) was estimated by DLS on a DynaPro plate reader (Wyatt Technology, DynaPro PlateReader-II) equipped with an 831 nm laser.60,61 Samples were measured at multiple concentrations, c, ranging from 1 g/L to 20 g/L. The KD value was then calculated with Equation 2:
DYNAMICS software (Wyatt Technology) was used to plot the Dc (diffusion coefficients) as a function of concentration, with D0 (the coefficient at infinite dilution) determined from the y-axis intercept and KD from the slope of the fitted straight line.
Differential scanning fluorimetry
DSF was performed on an UNcle system (Unchained Labs, UNcle) by monitoring intrinsic fluorescence intensity ratio (350/330 nm), which is sensitive to the tryptophan exposure as protein unfolds. Nine microliters of sample were loaded in triplicate in the Uni tubes (Unchained labs, 201–1009) and temperature ramping was run from 25°C to 85°C at 1°C increment per minute. Tm was defined as the maximum value of the first derivative of the BCM trace using UNcle software (Version 2.0).
Homology modeling
Homology model of the protein IgG4-N1 was generated using the MODELER software with full-length antibody structures, 1IGY and 1IGT as templates.62 The protonation of protein at different pH was calculated with PDB2PQR program using default PARSE force field and homologous model of the protein.63 The protonated protein model was adopted to calculate surface charge of the protein with APBS.64 The charge surface was displayed using PyMol.65
CFD modeling
The geometry and mesh of the SUM-100 and SUM-50 mixing bags were created by Workbench ANSYS 18.1 (Ansys Inc., Cannonsburg, PA). The bag diameter and impeller length are 0.44 m and 0.15 m for SUM-100 as shown in Figure 8 and 0.35 m and 0.15 m for SUM-50, respectively. The number of mesh elements was greater than 2.0 million in all cases. The computational domain was divided into a rotating zone and a stationary zone. The software is capable of working on the species transfer model with constant volume. In this study, the constant volume, equivalent to the average of the initial and final volumes during VIA, was used for modeling. Consequently, two outlets that were not existent in the bag were added to ensure constant liquid level, of which the total flow-out rate is equal to the titrant flow rate at the inlet. The volume fractions of 0.1 and 0.9 predetermined by simulations were assigned to upper and bottom outlet, respectively.
Figure 8.

Geometry of a SUM-100 bag. Acid inlet is shown in red. Outflows are shown in blue.
Simulations were carried out using FLUENT 18.1. The density and viscosity of PAE are 1006.7 kg/m3 and 1.297 mPa⋅s, while those for 0.1 N HCl are 999.8 kg/m3 and 1.022 mPa⋅s, respectively. All solid walls were no-slip boundaries. The top liquid surface was the slip wall boundary without shear stress. The model parameters were adapted from literature,42 except for the following modifications. At the first step of single-phase model, realizable k-ϵ turbulence model was applied under the steady condition. After converged simulation, inlet boundary was changed from wall to mass-flow-rate inlet with PAE flow and outlet boundaries were changed from wall to outflow. Additional 2,000 iterations were then performed to prime the inlet flow rate. At the second step of species transfer model under transition condition with 0.05 s per time step, the simulation was performed for 1 s to initialize tracer mass fraction. The iso-surface of tracer mass fraction that is equivalent to pH 3.3 was then defined. The volume-averaged tracer mass fraction and area of pH 3.3 iso-surface were recorded in the simulation.
The ILPZ (m3 s) is calculated by Equation 3, which is the integral area of low-pH (≤ pH 3.3) iso-surface over the acid addition duration. The PAE protein concentration, mixing, and instant pH at each time interval was considered in ILPZ calculations. In addition to the area of low-pH (≤ pH 3.3) iso-surface (A in m2), time interval (Δt in s), and acid addition duration (n), MpH 3.3 (%) is the HMW formed after a 10 min hold at pH 3.3, which is dependent on IgG4-N1 concentration and was previously measured in bench scale experiments. Fc is the acid mass fraction at pH 3.3 and Ft is instant acid mass fraction. Fc/(Fc – Ft) is the factor that reflects the impact of instant pH at a time interval.
Abbreviation
- CFD
computational fluid dynamics
- DLS
dynamic light scattering
- DSF
differential scanning fluorimetry
- ICH
International Council for Harmonization
- IgG
immunoglobulin G
- KD
diffusion interaction parameter
- mAb
monoclonal antibody
- PAE
Protein A eluate
- SEC
size exclusion chromatography
- Tm
melting temperature
- VI
viral inactivation
- VIA
viral inactivation acidification
- VIN
viral inactivation neutralization
Acknowledgments
The authors would like to thank John Pagano, Srujana Govindarajulu, and Danielle Belluscio for executing the scale-up runs. The authors would also like to thank Jianlin (Jim) Xu for generating cell culture materials used in this study, Nela Zvereva and David Wang for performing SEC-MALS analysis, and Steven Traylor, Jeff Beckman, and Melissa Holstein for reviewing the manuscript and providing valuable comments.
Disclosure of Potential Conflicts of Interest
No potential conflict of interest was reported by the authors.
Supplemental Material
Supplemental data for this article can be accessed on the publisher’s website.
Correction Statement
This article has been republished with minor changes. These changes do not impact the academic content of the article.
References
- 1.Ecker DM, Jones SD, Levine HL.. The therapeutic monoclonal antibody market. MAbs. 2015;7:9–14. doi: 10.4161/19420862.2015.989042. [DOI] [PMC free article] [PubMed] [Google Scholar]
- 2.Chaisri U, Chaicumpa W. Evolution of therapeutic antibodies, influenza virus biology, influenza, and influenza immunotherapy. Biomed Res Int. 2018;2018:1–23. doi: 10.1155/2018/9747549. [DOI] [PMC free article] [PubMed] [Google Scholar]
- 3.Thakur A, Huang M, Lum LG. Bispecific antibody based therapeutics: strengths and challenges. Blood Rev. 2018;32:339–47. doi: 10.1016/j.blre.2018.02.004. [DOI] [PubMed] [Google Scholar]
- 4.Liu HF, Ma J, Winter C, Bayer R. Recovery and purification process development for monoclonal antibody production. MAbs. 2010;2:480–99. doi: 10.4161/mabs.2.5.13089. [DOI] [PMC free article] [PubMed] [Google Scholar]
- 5.International Conference on Harmonisation of Technical Requirements for Registration of Pharmaceuticals for Human Use Viral Safety Evaluation of Biotechnology Products Derived From Cell Lines of Human or Animal Origin Q5a(R1) [Internet]. 1999.
- 6.Parker SA, Amarikwa L, Vehar K, Orozco R, Godfrey S, Coffman J, Shamlou P, Bardliving CL. Design of a novel continuous flow reactor for low pH viral inactivation. Biotechnol Bioeng. 2018;115:606–16. doi: 10.1002/bit.v115.3. [DOI] [PubMed] [Google Scholar]
- 7.Brorson K, Krejci S, Lee K, Hamilton E, Stein K, Xu Y. Bracketed generic inactivation of rodent retroviruses by low pH treatment for monoclonal antibodies and recombinant proteins. Biotechnol Bioeng. 2003;82:321–29. doi: 10.1002/bit.10607. [DOI] [PubMed] [Google Scholar]
- 8.Mattila J, Clark M, Liu S, Pieracci J, Gervais TR, Wilson E, Galperina O, Li X, Roush D, Zoeller K, et al. Retrospective evaluation of low-ph viral inactivation and viral filtration data from a multiple company collaboration. PDA J Pharm Sci Technol. 2016;70:293–99. doi: 10.5731/pdajpst.2016.006478. [DOI] [PubMed] [Google Scholar]
- 9.Shukla AA, Hubbard B, Tressel T, Guhan S, Low D. Downstream processing of monoclonal antibodies – application of platform approaches. J Chromatogr B. 2007;848:28–39. doi: 10.1016/j.jchromb.2006.09.026. [DOI] [PubMed] [Google Scholar]
- 10.Gagnon P, Nian R, Leong D, Hoi A. Transient conformational modification of immunoglobulin G during purification by protein A affinity chromatography. J Chromatogr A. 2015;1395:136–42. doi: 10.1016/j.chroma.2015.03.080. [DOI] [PubMed] [Google Scholar]
- 11.Filipe V, Kükrer B, Hawe A, Jiskoot W. Transient molten globules and metastable aggregates induced by brief exposure of a monoclonal IgG to Low pH. J Pharm Sci. 2012;101:2327–39. doi: 10.1002/jps.23157. [DOI] [PubMed] [Google Scholar]
- 12.Brummitt RK, Nesta DP, Chang L, Chase SF, Laue TM, Roberts CJ. Nonnative aggregation of an IgG1 antibody in acidic conditions: part 1. Unfolding, colloidal interactions, and formation of high-molecular-weight aggregates. J Pharm Sci. 2011;100:2087–103. doi: 10.1002/jps.22448. [DOI] [PubMed] [Google Scholar]
- 13.Latypov RF, Hogan S, Lau H, Gadgil H, Liu D. Elucidation of acid-induced unfolding and aggregation of human immunoglobulin IgG1 and IgG2 Fc. J Biol Chem. 2012;287:1381–96. doi: 10.1074/jbc.M111.297697. [DOI] [PMC free article] [PubMed] [Google Scholar]
- 14.Wang W, Nema S, Teagarden D. Protein aggregation – pathways and influencing factors. Int J Pharm. 2010;390:89–99. doi: 10.1016/j.ijpharm.2010.02.025. [DOI] [PubMed] [Google Scholar]
- 15.Skamris T, Tian X, Thorolfsson M, Karkov HS, Rasmussen HB, Langkilde AE, Vestergaard B. Monoclonal antibodies follow distinct aggregation pathways during production-relevant acidic incubation and neutralization. Pharm Res. 2016;33:716–28. doi: 10.1007/s11095-015-1821-0. [DOI] [PubMed] [Google Scholar]
- 16.Barnett GV, Drenski M, Razinkov V, Reed WF, Roberts CJ. Identifying protein aggregation mechanisms and quantifying aggregation rates from combined monomer depletion and continuous scattering. Anal Biochem. 2016;511:80–91. doi: 10.1016/j.ab.2016.08.002. [DOI] [PMC free article] [PubMed] [Google Scholar]
- 17.BS K, JL C, Lam X, Nguyen T, TW R, Manning MC, JF C. Aggregation of recombinant human interferon gamma: kinetics and structural transitions. J Pharm Sci. 1998;87:1069–76. doi: 10.1021/js9801384. [DOI] [PubMed] [Google Scholar]
- 18.Lumry R, Eyring H. Conformation changes of proteins. J Phys Chem. 1954;58:110–20. doi: 10.1021/j150512a005. [DOI] [Google Scholar]
- 19.Khurana R, Joel R, Gillespie JR, Talapatra A, Minert LJ, Ionescu-Zanetti C, Millett I, Fink AL. Partially folded intermediates as critical precursors of light chain amyloid fibrils and amorphous aggregates. 2001. doi: 10.1021/bi001782b. [DOI] [PubMed] [Google Scholar]
- 20.Ptitsyn OB, Pain RH, Semisotnov GV, Zerovnik E, Razgulyaev OI. Evidence for a molten globule state as a general intermediate in protein folding. FEBS Lett. 1990;262:20–24. doi: 10.1016/0014-5793(90)80143-7. [DOI] [PubMed] [Google Scholar]
- 21.Wang W, Roberts CJ. Protein aggregation – mechanisms, detection, and control. Int J Pharm. 2018;550:251–68. doi: 10.1016/j.ijpharm.2018.08.043. [DOI] [PubMed] [Google Scholar]
- 22.Arosio P, Rima S, Morbidelli M. Aggregation mechanism of an IgG2 and two IgG1 monoclonal antibodies at low pH: from oligomers to larger aggregates. Pharm Res. 2013;30:641–54. doi: 10.1007/s11095-013-1045-0. [DOI] [PubMed] [Google Scholar]
- 23.Sahin E, Grillo AO, Perkins MD, Roberts CJ. Comparative effects of pH and ionic strength on protein–protein interactions, unfolding, and aggregation for IgG1 antibodies. J Pharm Sci. 2010;99:4830–48. doi: 10.1002/jps.22198. [DOI] [PubMed] [Google Scholar]
- 24.Ejima D, Tsumoto K, Fukada H, Yumioka R, Nagase K, Arakawa T, Philo JS. Effects of acid exposure on the conformation, stability, and aggregation of monoclonal antibodies. Proteins Struct Funct Bioinforma. 2006;66:954–62. doi: 10.1002/prot.21243. [DOI] [PubMed] [Google Scholar]
- 25.Chi EY, Krishnan S, Randolph TW, Carpenter JF. Physical stability of proteins in aqueous solution: mechanism and driving forces in nonnative protein aggregation. Pharm Res. 2003;20:1325–36. doi: 10.1023/A:1025771421906. [DOI] [PubMed] [Google Scholar]
- 26.Krishnan S, EY C, JN W, BS C, Shan D, Goldenberg M, Manning MC, TW R, Carpenter JF. Aggregation of granulocyte colony stimulating factor under physiological conditions: characterization and thermodynamic inhibition. Biochemistry. 2002;41:6422–31. doi: 10.1021/bi012006m. [DOI] [PubMed] [Google Scholar]
- 27.Roberts CJ. Therapeutic protein aggregation: mechanisms, design, and control. Trends Biotechnol. 2014;32:372–80. doi: 10.1016/j.tibtech.2014.05.005. [DOI] [PMC free article] [PubMed] [Google Scholar]
- 28.Kumar V, Dixit N, Zhou LL, Fraunhofer W. Impact of short range hydrophobic interactions and long range electrostatic forces on the aggregation kinetics of a monoclonal antibody and a dual-variable domain immunoglobulin at low and high concentrations. Int J Pharm. 2011;421:82–93. doi: 10.1016/j.ijpharm.2011.09.028. [DOI] [PubMed] [Google Scholar]
- 29.Wawer J, Szociński M, Olszewski M, Piątek R, Naczk M, Krakowiak J. Influence of the ionic strength on the amyloid fibrillogenesis of hen egg white lysozyme. Int J Biol Macromol. 2019;121:63–70. doi: 10.1016/j.ijbiomac.2018.10.134. [DOI] [PubMed] [Google Scholar]
- 30.Kastelic M, Kalyuzhnyi YV, Hribar-Lee B, Dill KA, Vlachy V. Protein aggregation in salt solutions. Proc Natl Acad Sci U S A. 2015;112:6766–70. doi: 10.1073/pnas.1507303112. [DOI] [PMC free article] [PubMed] [Google Scholar]
- 31.Hofmann M, Winzer M, Weber C, Gieseler H. Prediction of protein aggregation in high concentration protein solutions utilizing protein-protein interactions determined by low volume static light scattering. J Pharm Sci. 2016;105:1819–28. doi: 10.1016/j.xphs.2016.03.022. [DOI] [PubMed] [Google Scholar]
- 32.Bickel F, Herold EM, Signes A, Romeijn S, Jiskoot W, Kiefer H. Reversible NaCl-induced aggregation of a monoclonal antibody at low pH: characterization of aggregates and factors affecting aggregation. Eur J Pharm Biopharm. 2016;107:310–20. doi: 10.1016/j.ejpb.2016.07.020. [DOI] [PubMed] [Google Scholar]
- 33.Stigter D, Alonso DO, Dill KA. Protein stability: electrostatics and compact denatured states. Proc Natl Acad Sci. 1991;88:4176–80. doi: 10.1073/pnas.88.10.4176. [DOI] [PMC free article] [PubMed] [Google Scholar]
- 34.Xia Y, Park YD, Mu H, Zhou HM, Wang XY, Meng FG. The protective effects of osmolytes on arginine kinase unfolding and aggregation. Int J Biol Macromol. 2007;40:437–43. doi: 10.1016/j.ijbiomac.2006.10.001. [DOI] [PubMed] [Google Scholar]
- 35.Barbosa LRS, Ortore MG, Spinozzi F, Mariani P, Bernstorff S, Itri R. The importance of protein-protein interactions on the pH-induced conformational changes of bovine serum albumin: a small-angle x-ray scattering study. Biophys J. 2010;98:147–57. doi: 10.1016/j.bpj.2009.09.056. [DOI] [PMC free article] [PubMed] [Google Scholar]
- 36.Sarangapani P, Jones RL, Hudson S, Pathak JA. The pH and concentration dependence of protein-protein interactions, conformation, and viscosity in crowded protein solutions. Biophys J. 2014;106:665a–666a. doi: 10.1016/j.bpj.2013.11.3685. [DOI] [Google Scholar]
- 37.Bylund F, Collet E, Enfors S-O, Larsson G. Substrate gradient formation in the large-scale bioreactor lowers cell yield and increases by-product formation. Bioprocess Eng. 1998;18:171. doi: 10.1007/s004490050427. [DOI] [Google Scholar]
- 38.Wayte J, Boraston R, Bland H, Varley J, Brown M. pH: effects on growth and productivity of cell lines producing monoclonal antibodies: control in large-scale fermenters. Genet Eng Biotechnol. 1997;17:125–32. [Google Scholar]
- 39.Langheinrich C, Nienow AW. Control of pH in large-scale, free suspension animal cell bioreactors: alkali addition and pH excursions. Biotechnol Bioeng. 1999;66:171–79. doi: 10.1002/(ISSN)1097-0290. [DOI] [PubMed] [Google Scholar]
- 40.Xing Z, Kenty BM, Li ZJ, Lee SS. Scale-up analysis for a CHO cell culture process in large-scale bioreactors. Biotechnol Bioeng. 2009;103:733–46. doi: 10.1002/bit.v103:4. [DOI] [PubMed] [Google Scholar]
- 41.Orozco R, Godfrey S, Coffman J, Amarikwa L, Parker S, Hernandez L, Wachuku C, Mai B, Song B, Hoskatti S, et al. Design, construction, and optimization of a novel, modular, and scalable incubation chamber for continuous viral inactivation. Biotechnol Prog. 2017;33:954–65. doi: 10.1002/btpr.2442. [DOI] [PubMed] [Google Scholar]
- 42.BS C, Wan B, Philyaw S, Dhanasekharan K, Ring TA. Residence time distributions in a stirred tank: comparison of CFD predictions with experiment. Ind Eng Chem Res. 2004;43:6548–56. doi: 10.1021/ie0308240. [DOI] [Google Scholar]
- 43.Renade VV. Computational flow modeling for chemical reactor engineering. New York (NY): Academic Press; 2002. [Google Scholar]
- 44.Vedantam S, Joshi JB, Koganti SB. CFD simulation of RTD and mixing in the annular region of a Taylor-Couette contactor. Ind Eng Chem Res. 2006;45:6360–67. doi: 10.1021/ie050825n. [DOI] [Google Scholar]
- 45.Paul EL, Atiemo-Obeng VA, Kresta SM. Handbook of industrial mixing: science and practice.Internet. Hoboken (NJ): John Wiley & Sons, Inc.; 2004. [Google Scholar]
- 46.Levenspiel O. Chemical reaction engineering. New York (NY): Wiley-Blackwell; 1999. [Google Scholar]
- 47.Hayes RE. Introduction to chemical reactor analysis. New York (NY): Taylor & Francis; 2001. [Google Scholar]
- 48.Mazzer AR, Perraud X, Halley J, O’Hara J, Bracewell DG. Protein A chromatography increases monoclonal antibody aggregation rate during subsequent low pH virus inactivation hold. J Chromatogr A. 2015;1415:83–90. doi: 10.1016/j.chroma.2015.08.068. [DOI] [PMC free article] [PubMed] [Google Scholar]
- 49.Buchner J, Renner M, Lilie H, Hinz HJ, Jaenicke R, Kiefhabel T, Rudolph R. Alternatively folded states of an immunoglobulin. Biochemistry. 1991;30:6922–29. doi: 10.1021/bi00242a016. [DOI] [PubMed] [Google Scholar]
- 50.Ito T, Tsumoto K. Effects of subclass change on the structural stability of chimeric, humanized, and human antibodies under thermal stress. Protein Sci. 2013;22:1542–51. doi: 10.1002/pro.2340. [DOI] [PMC free article] [PubMed] [Google Scholar]
- 51.Ishikawa T, Ito T, Endo R, Nakagawa K, Sawa E, Wakamatsu K. Influence of pH on heat-induced aggregation and degradation of therapeutic monoclonal antibodies. Biol Pharm Bull. 2010;33:1413–17. doi: 10.1248/bpb.33.611. [DOI] [PubMed] [Google Scholar]
- 52.Liu B, Guo H, Xu J, Qin T, Xu L, Zhang J, Guo Q, Zhang D, Qian W, Li B, et al. Acid-induced aggregation propensity of nivolumab is dependent on the Fc. MAbs. 2016;8:1107–17. doi: 10.1080/19420862.2016.1196521. [DOI] [PMC free article] [PubMed] [Google Scholar]
- 53.Shukla AA, Gupta P, Han X. Protein aggregation kinetics during protein A chromatography. J Chromatogr A. 2007;1171:22–28. doi: 10.1016/j.chroma.2007.09.040. [DOI] [PubMed] [Google Scholar]
- 54.Chari R, Jerath K, Badkar AV, Kalonia DS. Long- and short-range electrostatic interactions affect the rheology of highly concentrated antibody solutions. Pharm Res. 2009;26:2607–18. doi: 10.1007/s11095-008-9767-0. [DOI] [PubMed] [Google Scholar]
- 55.Wälchli R, Ressurreição M, Vogg S, Feidl F, Angelo J, Xu X, Ghose S, Li ZJ, Le Saoût X, Souquet J, et al. Understanding mAb aggregation during low pH viral inactivation and subsequent neutralization. Submitted to Biotechnol. Bioeng. [DOI] [PubMed] [Google Scholar]
- 56.Redfield C, Smith RAG, Dobson CM. Structural characterization of a highly-ordered ‘molten globule’ at low pH. Nat Struct Mol Biol. 1994;1:23–29. doi: 10.1038/nsb0194-23. [DOI] [PubMed] [Google Scholar]
- 57.Daggett V, Levitt M. A model of the molten globule state from molecular dynamics simulations. Proc Natl Acad Sci U S A. 1992;89:5142–46. doi: 10.1073/pnas.89.11.5142. [DOI] [PMC free article] [PubMed] [Google Scholar]
- 58.Broglia RA, Tiana G, Pasquali S, Roman HE, Vigezzi E. Folding and aggregation of designed proteins. Proc Natl Acad Sci. 2002;95:12930–33. doi: 10.1073/pnas.95.22.12930. [DOI] [PMC free article] [PubMed] [Google Scholar]
- 59.Mukrasch MD, Markwick P, Biernat J, Von Bergen M, Bernadó P, Griesinger C, Mandelkow E, Zweckstetter M, Blackledge M. Highly populated turn conformations in natively unfolded tau protein identified from residual dipolar couplings and molecular simulation. J Am Chem Soc. 2007;129:5235–43. doi: 10.1021/ja0690159. [DOI] [PubMed] [Google Scholar]
- 60.Shi S, Uchida M, Cheung J, Antochshuk V, Shameem M. Method qualification and application of diffusion interaction parameter and virial coefficient. Int J Biol Macromol. 2013;62:487–93. doi: 10.1016/j.ijbiomac.2013.09.033. [DOI] [PubMed] [Google Scholar]
- 61.Nicoud L, Jagielski J, Pfister D, Lazzari S, Massant J, Lattuada M, Morbidelli M. Kinetics of monoclonal antibody aggregation from dilute toward concentrated conditions. J Phys Chem B. 2016;120:3267–80. doi: 10.1021/acs.jpcb.6b04525. [DOI] [PubMed] [Google Scholar]
- 62.Webb B, Sali A. Comparative protein structure modeling using MODELLER. Curr Protoc Bioinforma. 2016;2016:5.6.1–5.6.37. [DOI] [PMC free article] [PubMed] [Google Scholar]
- 63.Dolinsky TJ, Nielsen JE, McCammon JA, Baker NA. PDB2PQR: an automated pipeline for the setup of Poisson-Boltzmann electrostatics calculations. Nucleic Acids Res. 2004;32:W665–7. doi: 10.1093/nar/gkh381. [DOI] [PMC free article] [PubMed] [Google Scholar]
- 64.Baker NA, Sept D, Joseph S, Holst MJ, McCammon JA. Electrostatics of nanosystems: application to microtubules and the ribosome. Proc Natl Acad Sci. 2002;98:10037–41. doi: 10.1073/pnas.181342398. [DOI] [PMC free article] [PubMed] [Google Scholar]
- 65.DeLano WL, Lam JW. Affiliations DeLano Sci LLC SF PyMOL: a communications tool for computational models. Am Chem Soc. 2005;230:U1371–2. [Google Scholar]
Associated Data
This section collects any data citations, data availability statements, or supplementary materials included in this article.