
Figure 1.
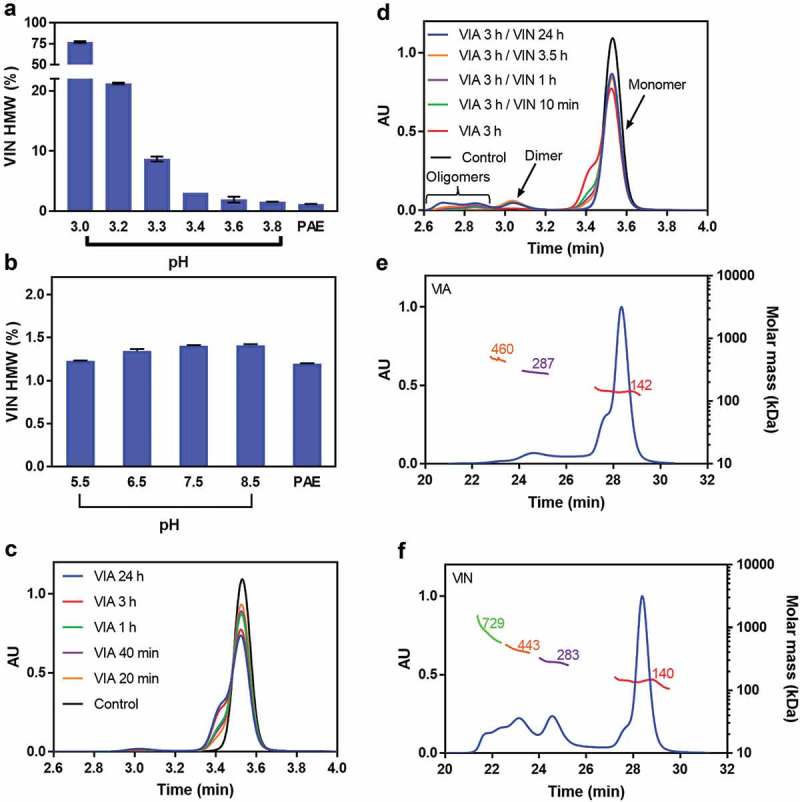
pH impact on IgG4-N1 aggregation. (a) Product HMW levels at VIA pH 3.0–3.8. PAE was adjusted to target VIA pH conditions and held for 1 h, then neutralized to pH 5.5, and tested for SEC after overnight equilibration. (b) Product HMW levels at pH 5.5–8.5. PAE was directly adjusted to target VIN pH conditions, and tested for SEC after overnight equilibration. (c) SEC chromatogram overlay for VIA samples at pH 3.3 with various hold times. The VIA samples were tested for SEC without pH neutralization. (d) SEC chromatogram overlay for VIN samples at pH 5.5 with various hold times. The 3 h hold VIA sample at pH 3.3 was neutralized to pH 5.5 and then held for various periods; the control sample was the PAE at pH 4.6 without pH adjustment. (e) SEC-MALS data for a VIA sample (pH 3.3 with 3 h hold). (f) SEC-MALS data for a VIN sample (VIA at pH 3.3 with 3 h hold, then neutralized to pH 5.5 with 3.5 h hold). The error bars in (a) and (b) represent standard deviation of duplicate experiments.