
Figure 5.
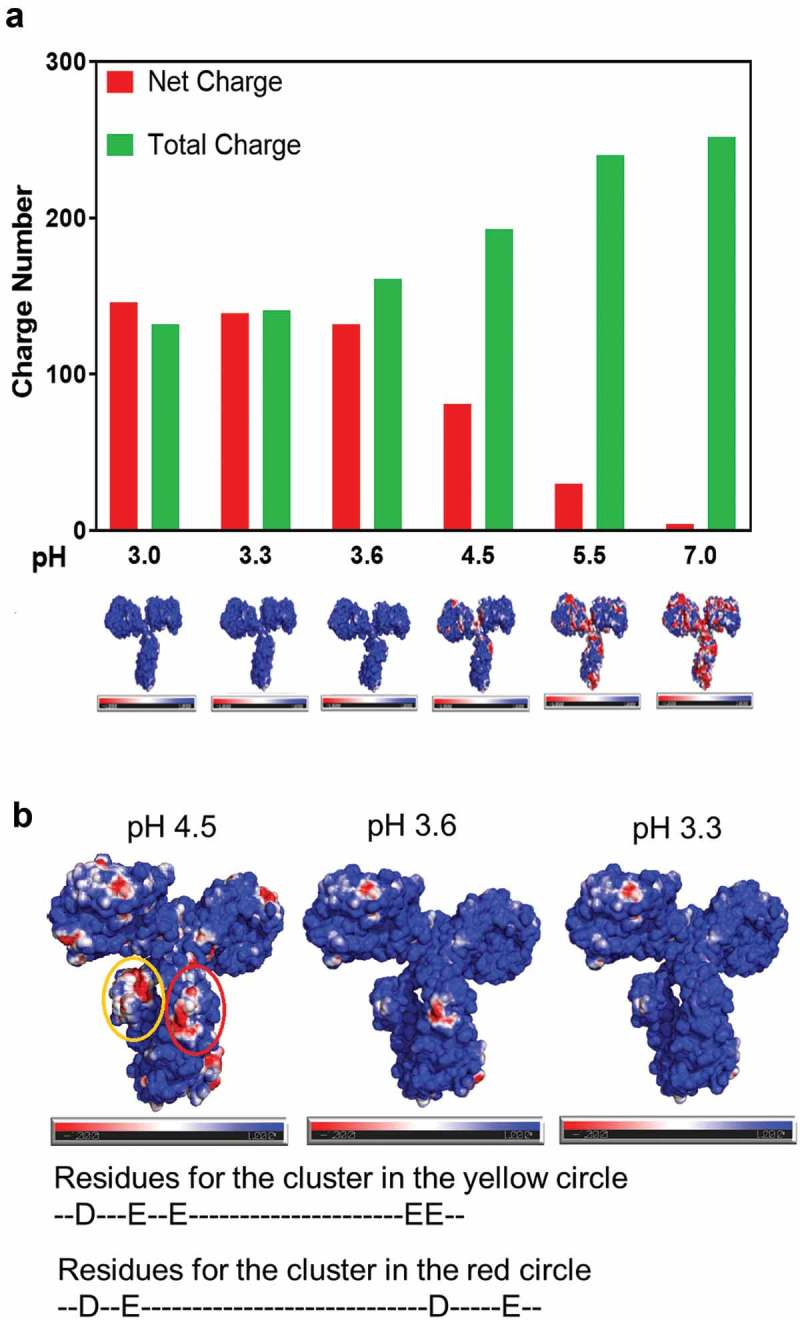
Charge property of IgG4-N1 by homology modeling in various solution pH conditions. (a) Net and total charge at pH 3.0–7.0, with the corresponding surface charge distribution where positive, negative, and neutral charges are shown in blue, red, and white, respectively. (b) Comparison of the surface charge distribution at pH 4.5, 3.6 and pH 3.3, where negatively charged clusters at pH 4.5 (in CH2) are circled in yellow and red, with the corresponding contributing amino acid residues.