
Figure 7.
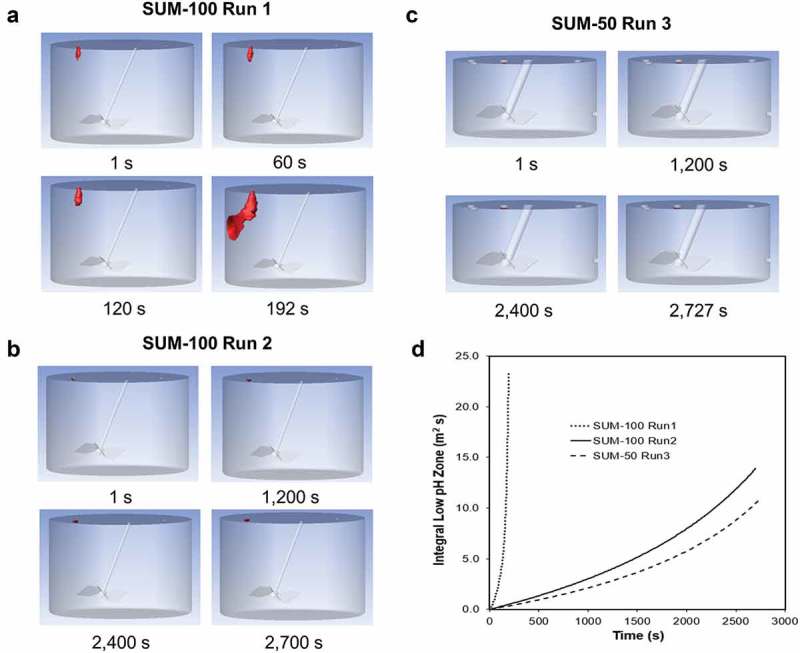
SUM run mixing conditions simulated by CFD. (a) SUM-100 Run 1 in non-optimized mixing condition. (b) SUM-100 Run 2 in optimized mixing condition. (c) SUM-50 Run 3 in optimized mixing condition. (d) Integral Low-pH Zone (m3 s) of the three runs as a function of time in seconds (s). Localized low-pH region (≤pH 3.3) in (a), (b), and (c) is shown in red.