Figure 7.

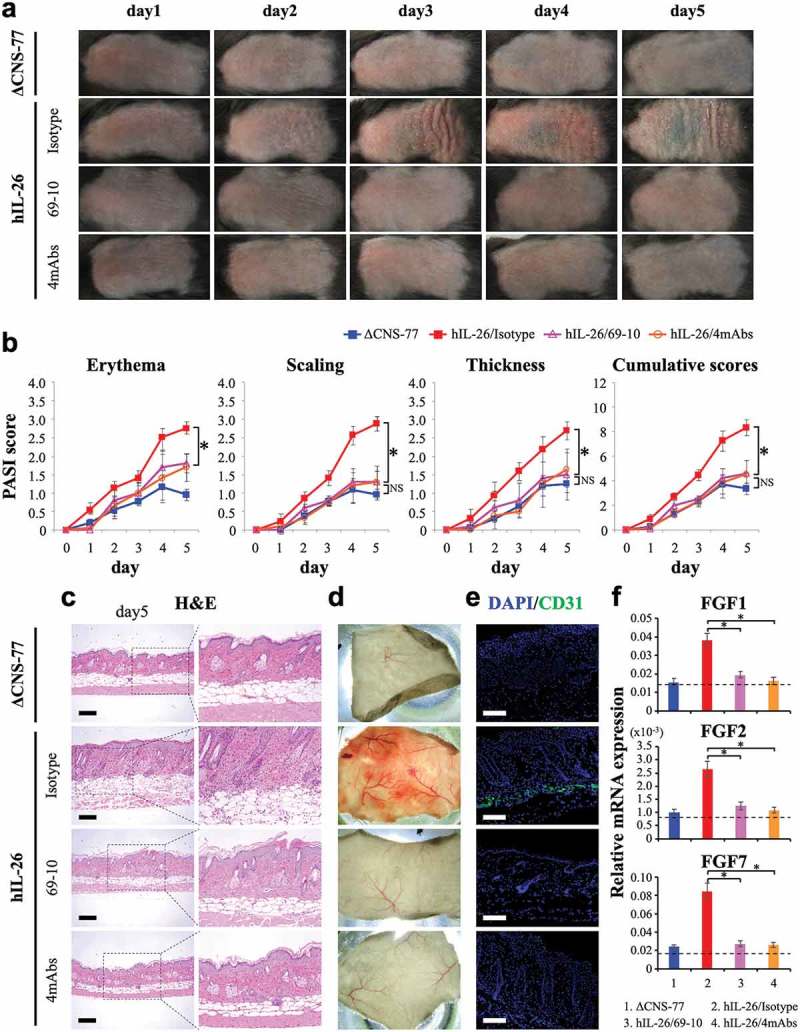
Anti-IL-26 mAb treatment suppresses IMQ-induced skin inflammation via inhibition of angiogenesis and infiltration of inflammatory cells.
Data are shown from IMQ (20 mg)-treated back skin in ΔCNS-77 Tg mice, hIL-26Tg mice treated with anti-IL-26 mAb (69–10 mAb alone or the combination of 4 mAbs) or isotype control mAb. (a) Phenotypical representation of each group. Representative images are shown (n = 6 mice for each group at each time point). (b) Time course of PASI scores (erythema, scaling and thickness were scored daily on a scale from 0 to 4, respectively) in each group (n = 6 mice for each group at each time point). Data are shown as mean ± S.D. of each group, comparing values in hIL-26Tg mice treated with anti-IL-26 mAb to those in hIL-26Tg mice injected with isotype control mAb or those in ΔCNS-77 Tg mice (* p < 0.01). NS denotes ‘not significant’. Data represent the combined results of two independent experiments. (c) H&E staining of skin lesions from each group on day-5. Higher magnification images show inflammatory cell infiltration. Original magnification x100. Scale bar, 200 μm. (d) Subcutaneous vascular formation of each group on day-5. (e) Immunofluorescence staining of skin lesions from each group on day-5 using anti-CD31 pAb. Positive cells were shown in green. All sections were stained with DAPI to mark the nuclei (blue). Original magnification x100. Scale bar, 200 μm. (c-e) Representative images are shown with similar results (for each, n = 6 mice). (f) mRNA expression levels of FGF1, FGF2 and FGF7 in skin lesions from each group on day-3 (n = 6 mice for each group). Each expression was normalized to hypoxanthine phosphoribosyltransferase (HPRT). The dashed line is the mean value of non-treated mice. Data are shown as mean ± S.D. of each group, comparing values in hIL-26Tg mice treated with anti-IL-26 mAb to those in hIL-26Tg mice injected with isotype control mAb (* p < 0.01).
