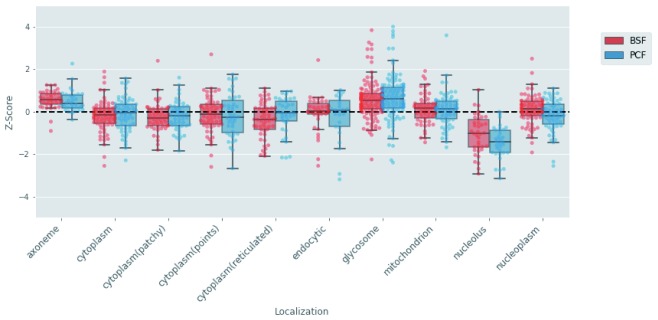
Figure 12. Protein half-life and protein localization analysis.
The protein half-life values of the bloodstream form (BSF) (red) and polycyclic form (PCF) (blue) life stages were transformed to z-scores. The distributions of the z-score values (y-axis) are visualised with boxplots for each cell compartment (x-axis) derived from the annotations extracted from the TrypTag database.

