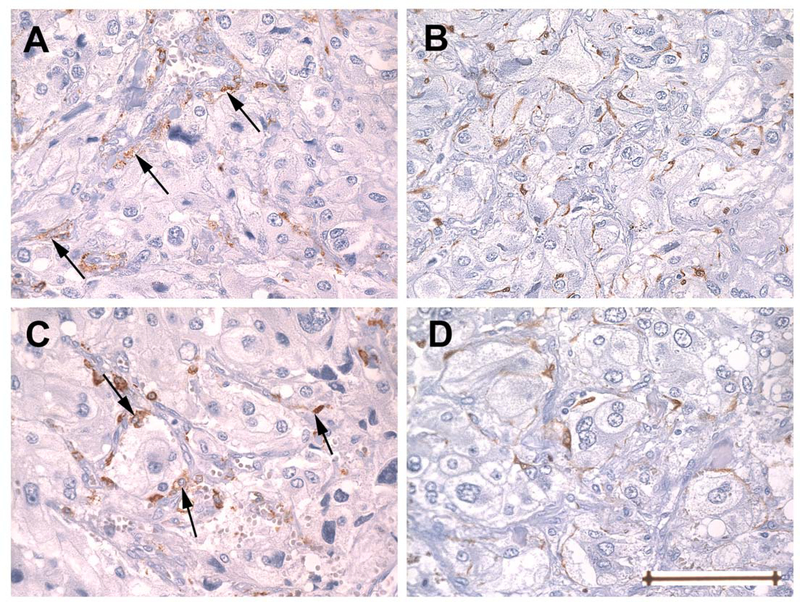
Fig. 1.
Adjacent sections of tissue microarray showing representative patterns of staining for CD163 (A, C) and S-100 (B, D) as seen in two cores from a single tumor. Panels A and B are from one core, C and D from another. Cells immunoreactive for CD 163 (arrows) are predominantly perivascular in A, while in C they are predominantly at the periphery of Zellballen or, less often, interstitial (right arrow). The latter pattern resembles the distribution of sustentacular cells stained for S-100 seen in both cores. In contrast to cells staining for CD163, cells that stain for S-100 are found only in an interstitial/peripheral distribution and are not perivascular. Original magnification 400x, Bar = 100um

