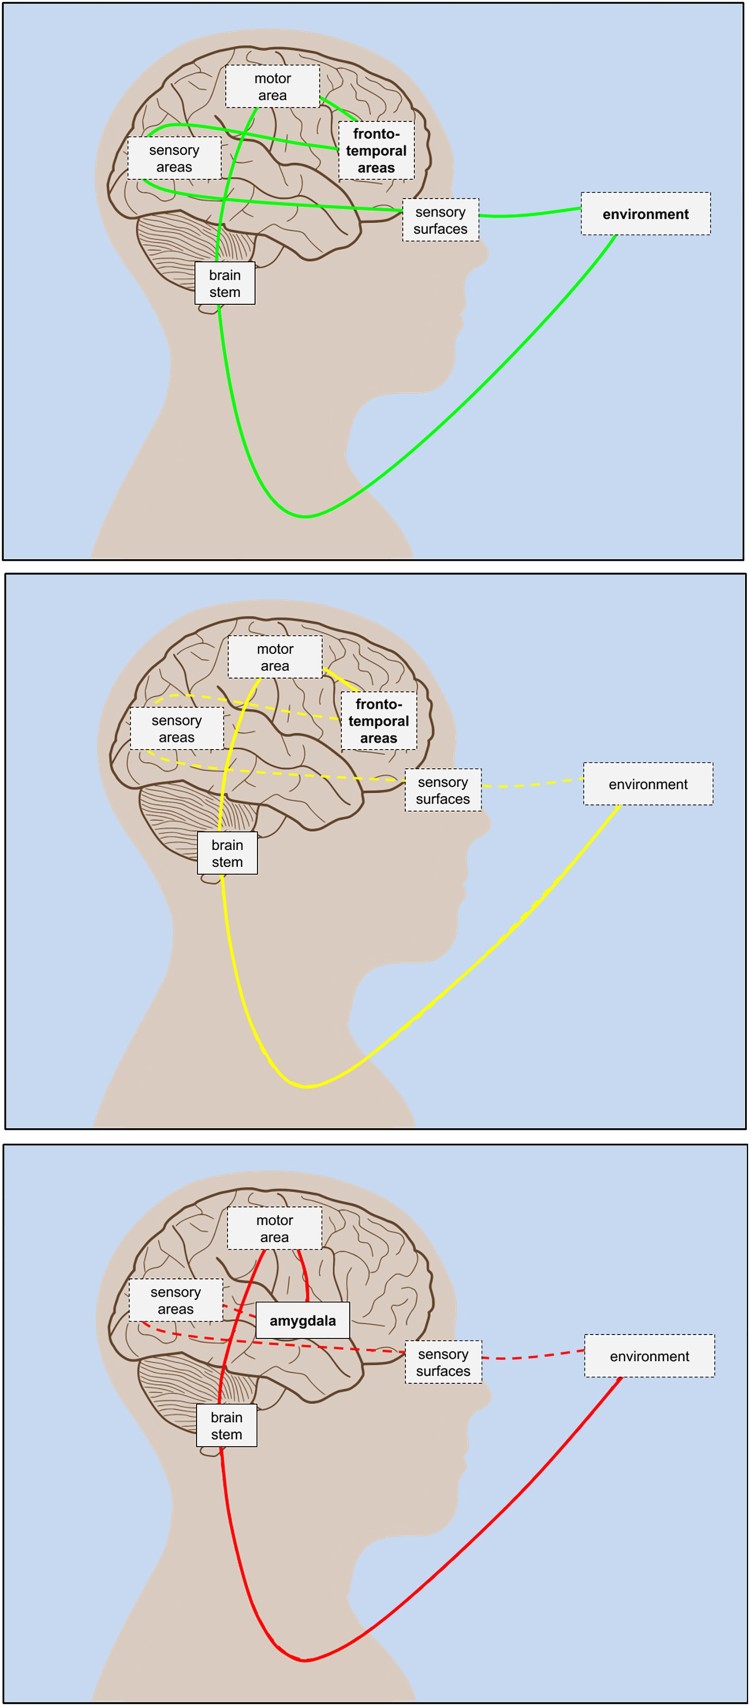
Figure 1.
Simplified schematic model of active inference sensorimotor loop. Solid lines indicate strong / dense correspondence (high mutual information), dashed lines indicate weak / sparse correspondence (low mutual information). Bold typeface indicates modulatory influence driving propagation. Lines passing through depicted brain regions indicate primary relevant (bidirectional) pathways. Top panel: Healthy function. Full loop through environment-body-brain system joins traditional top-down and bottom-up directions with balanced agent (frontotemporal) / environment modulatory coupling. Middle panel: Psychosis-related dysfunction. Functional decoupling between traditional top-down and bottom-up pathways; impairment in traditional “reality testing”. Bottom panel: Stress-related dysfunction (e.g., PTSD). Hypofrontal amygdala activation in “fight or flight”.

