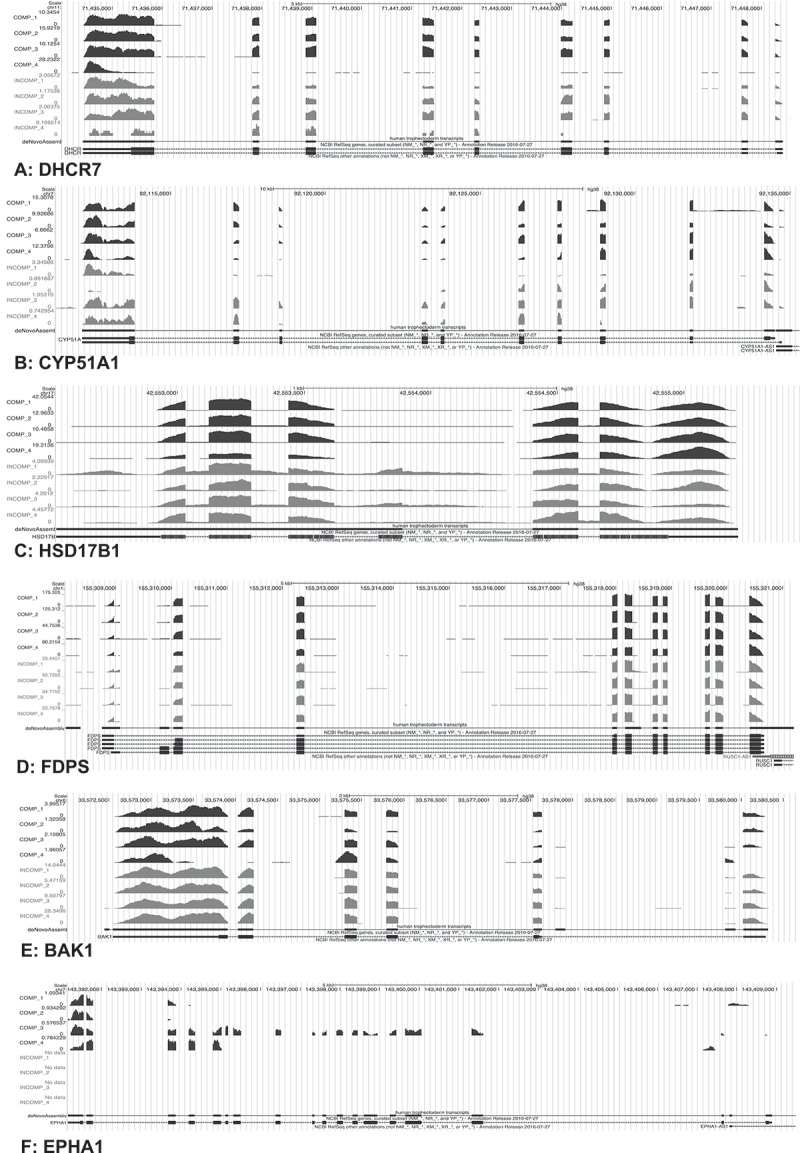
Figure 2.

UCSC genome browser tracks of selected DE transcripts. The plot shows pile-ups of sequencing reads assembled into transcripts for six different genes in eight TE samples. The top four pile-ups (per gene) correspond to gene expression in the competent (COMP) blastocysts and the bottom four to the incompetent (INCOMP) blastocysts. A de novo transcriptome assembly track is shown below each pile-up guided by the hg38 reference genome (black). The track corresponds to all exons detected by StringTie, including novel exons. The bottom track per gene represents the NCBI RefSeq gene annotation. The boxes in the lower two pile-ups represent the exons and the arrows the introns and expected direction of gene expression. The graph depicts a total of four representative transcripts; DHCR7 (A), CYP51A1 (B), HSD17B1 (C), and FDPS (D) that were down-regulated and one transcript, BAK1 (E), that was up-regulated in incompetent blastocysts and one transcript, EPHA1 (F), with poorer exon coverage. Scales for peak heights, representing pile-ups of read counts (CPM) are shown to the left of each plot.
