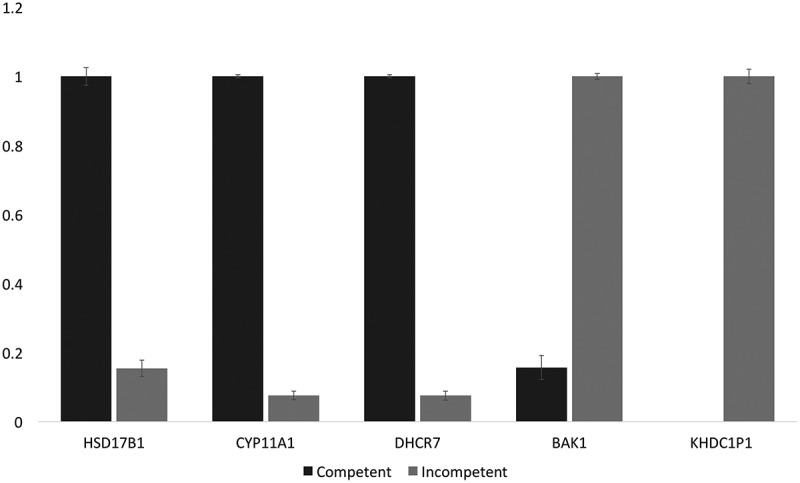
Figure 4.

Normalized qPCR results for verification of DE analysis. Following 2−ΔΔCt normalization and calculation relative to GAPDH expression (stable among our samples), the more highly expressed of the pairs in each case were set to 1.0 (arbitrary units). The chart shows that among the incompetent blastocysts, HSD17B1, CYP11A1, and DHCR7 were significantly down-regulated, while BAK1 and KHDC1P1 were significantly up-regulated. Standard deviation error bars are also displayed in the graph. These results concord with the edgeR differential expression analysis obtained from the RNA-seq data.
