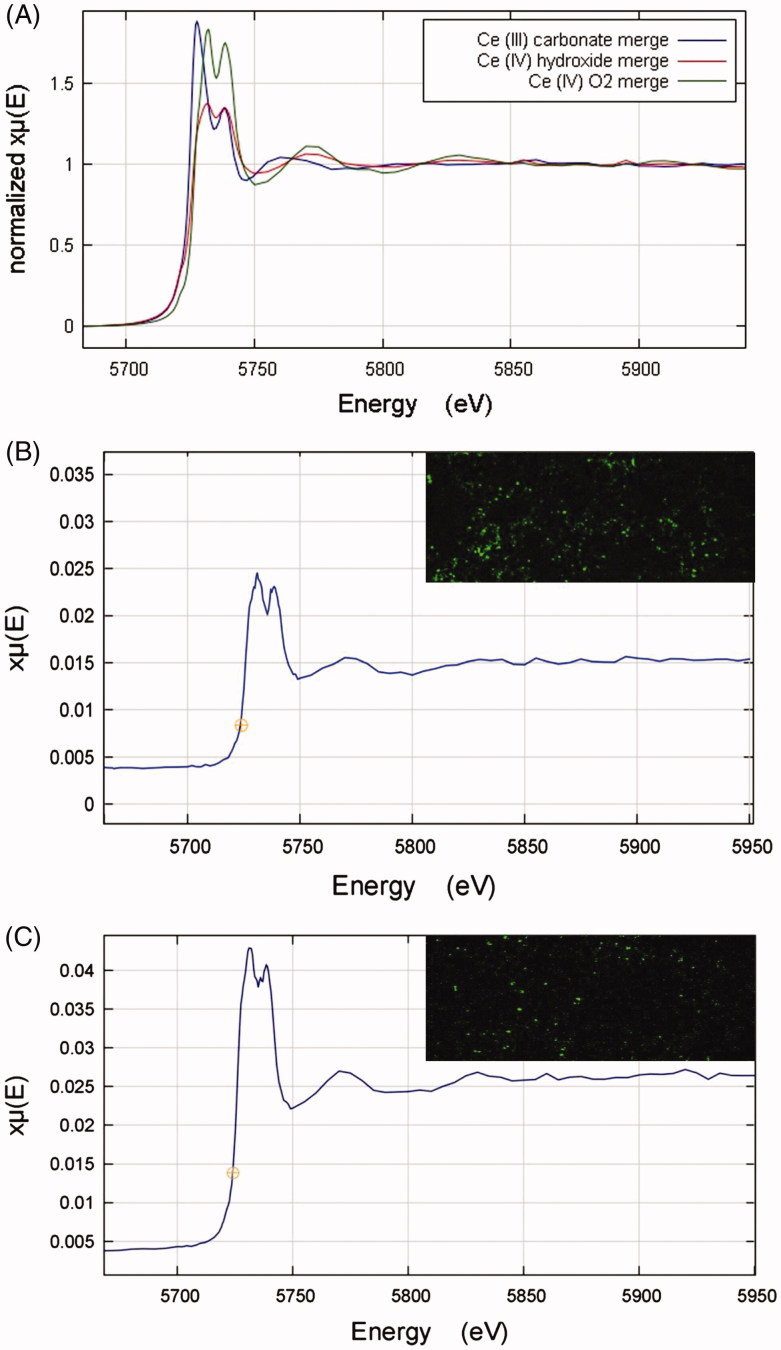
Figure 8.
(A) XANES Ce LIII spectra for cerium standard samples of Ce2(CO3)3, Ce(OH)4, and CeO2. (B–C) XANES Ce LIII spectra derived from cerium-rich pixels of elemental µ-XRF maps of lung tissue sections from rats exposed to the CeO2NP aerosols for two weeks at 3 d (B, A combination of 4 pixels) and 7 d (C, A combination of 6 pixels) post-exposure. The top right-hand corner images in B and C are the associated elemental µ-XRF maps of cerium in lung tissue samples from animals post-exposure. Data obtained using the I18 beamline at the Diamond Light Source (pixel size 4 µm × 4 µm).

