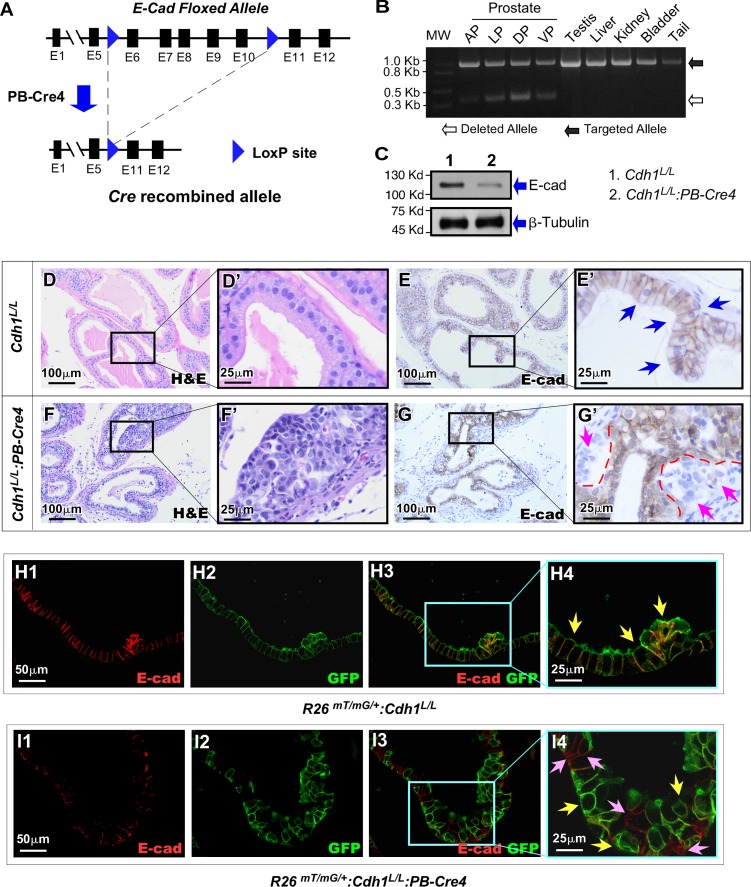
Fig 1. Generation of Probasin driven prostate specific deletion of E-cadherin in mice.
A. A scheme was shown of the targeted Cdh1 allele undergoing Probasin driven Cre mediated recombination. B. Recombination PCR with DNA isolated from Cdh1L/L:PB-Cre4 anterior prostate (AP), lateral prostate (LP), dorsal prostate (DP), ventral prostate (VP) and other tissues as indicated. Band sizes correspond to the DNA ladder in the left lane. C. Western blot results from protein lysates isolated from prostate tissues of Cdh1L/L: PB-Cre4 and Cdh1L/L control mice. D-G’. Representative H&E & E-cadherin IHC staining of prostate tissue sections from Cdh1L/L:PB-Cre4 and Cdh1L/L mice. Blue arrows indicate E-cadherin positive epithelium (E’). Pink arrows indicate E-cadherin negative regions with dotted lines marking the border between E-cadherin negative cells and surrounding E-cadherin positive epithelium (G’). H1-I4. Representative images of Co-IF staining of mouse prostate sections displaying overlay of E-cadherin and mGFP (yellow arrows, H4) in R26mTmG/+; PB-Cre4 control mice. Lost/reduced E-cadherin staining is observed in mGFP+ (yellow arrows, I4) cells of R26mTmG/+:Cdh1L/L:PB-Cre4 mice. Cells without mGFP expression retain E-cad positivity in R26mTmG/+:Cdh1L/L:PB-Cre4 mice (pink arrows, I4). Scale bars, located in the bottom left corner of images, are sized as indicated.

