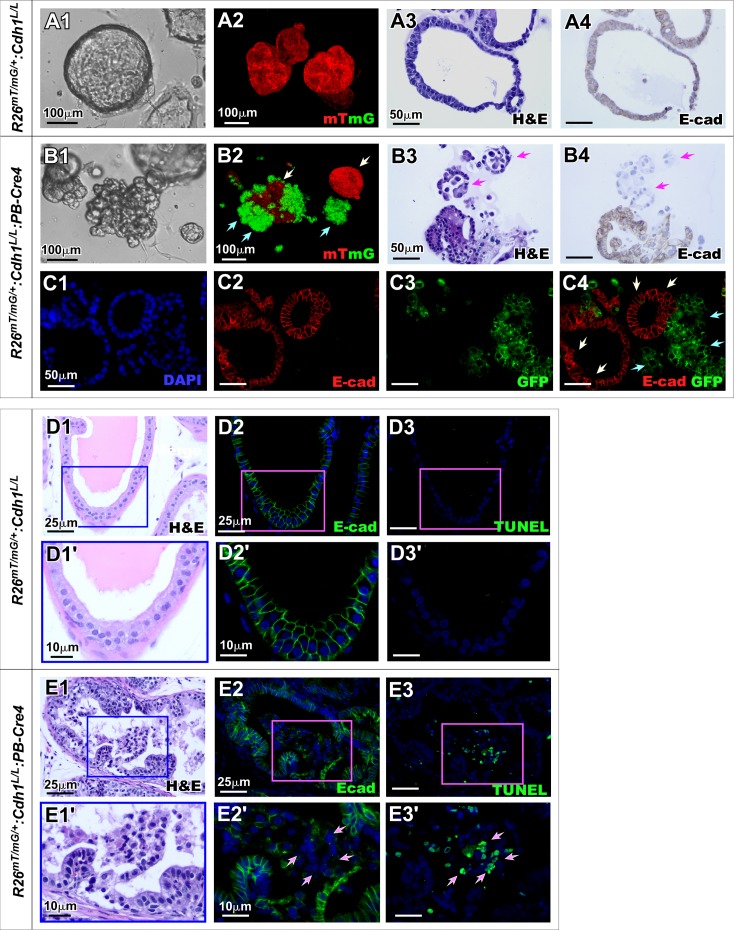
Fig 4. Loss of E-cadherin impedes prostatic epithelial integrity in organoid cultures.
A1-B4. Representative images comparing organoids established from primary prostate cells from R26mTmG/+:Cdh1L/L:PB-Cre4 mice and R26mTmG/+:Cdh1L/L littermate controls. Bright-field images depict organoid morphology observed in each genotype (A1, B1). 3D z-stack images of organoids expressing mTmG reporter fluorescence controlled by Cre recombination (A2 and B2). Green arrows indicate mG positive cells and white arrows indicate mT positive cells due to mosaic recombination events in R26mTmG/+:Cdh1L/L:PB-Cre4 mice (B2). Representative images of H&E staining and E-cadherin IHC staining in control and E-cadherin KO organoids (A3-A4, B3-B4). Arrows indicate unstructured E-cadherin negative cells separating from organoids (B3-B4). C1-C4. Representative fluorescence images of CoIF staining for E-cadherin and GFP in organoids. White arrows indicate mGFP- E-cadherin+ cells while green arrows indicate mGFP+ E-cadherin- cells (C4). D1-E3’ Representative H&E and fluorescence images of prostate tissue sections from R26mTmG/+:Cdh1L/L:PB-Cre4 and R26mTmG/+:Cdh1L/L mice. White arrows indicate E-cadherin negative cells and TUNEL positive cells (E2’ and E3’ respectively). Nuclei were stained with DAPI. Scale bars, located in the bottom left corner of images, are sized as indicated.

