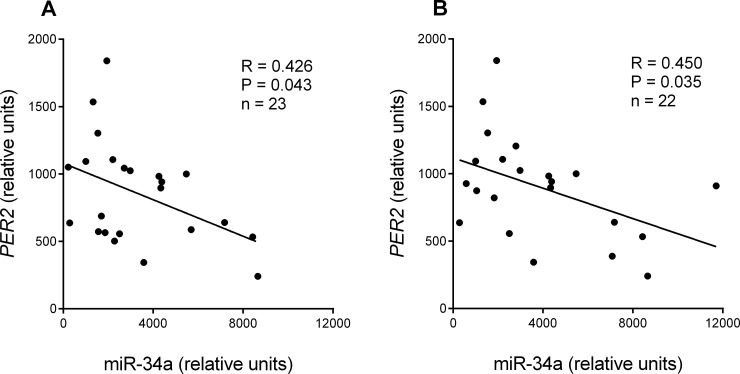
Fig 4.
Regression analysis of miR-34a and PER2 expression: (A) in tumour tissue of patients with clinical stage IIb and above, with metastases in a maximum of six lymph nodes; and (B) patients with tumour invasion T3 (tumour invaded through the muscularis propria into the pericolorectal tissues) and clinical stage III-IV. Solid line represents significant correlation. R, correlation coefficient; P, level of significance (regression analysis).

