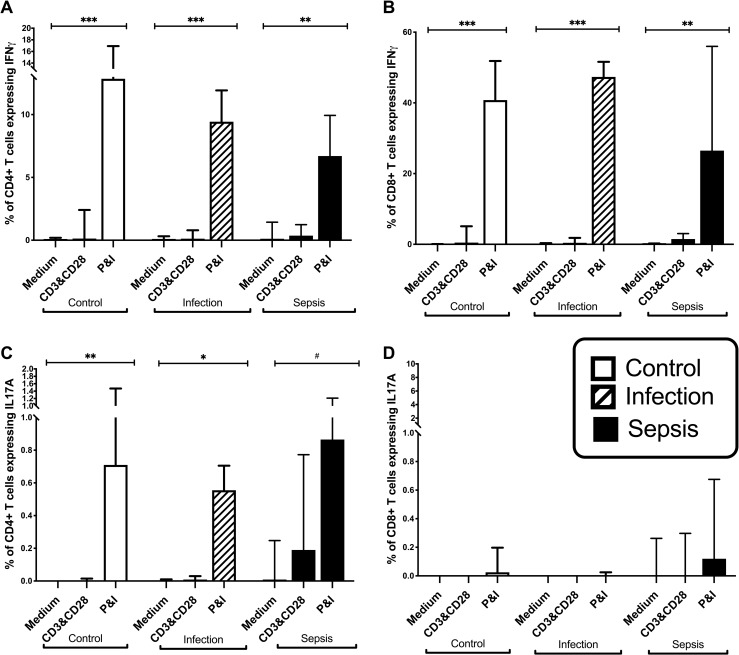
Fig 6. Frequency of IFNγ and IL17A expression on stimulated CD3+CD4+and CD3+CD8+ lymphocytes.
A-D, Frequencies of Interferon-γ (IFNγ) and IL17A expressing CD4+ and CD8+ T Cells in control subjects (n = 20), patients with infection (n = 19), and patients with sepsis (n = 32). Medium are unstimulated cells, CD3&CD28 is stimulation with CD3 and CD28 antibodies, P&I is stimulation with Phorbol Myristate Acetate and Ionomcyin. Data represented as median with interquartile range. (#p<0.05;*p<0.01;**p<0.001; ***p<0.0001).

