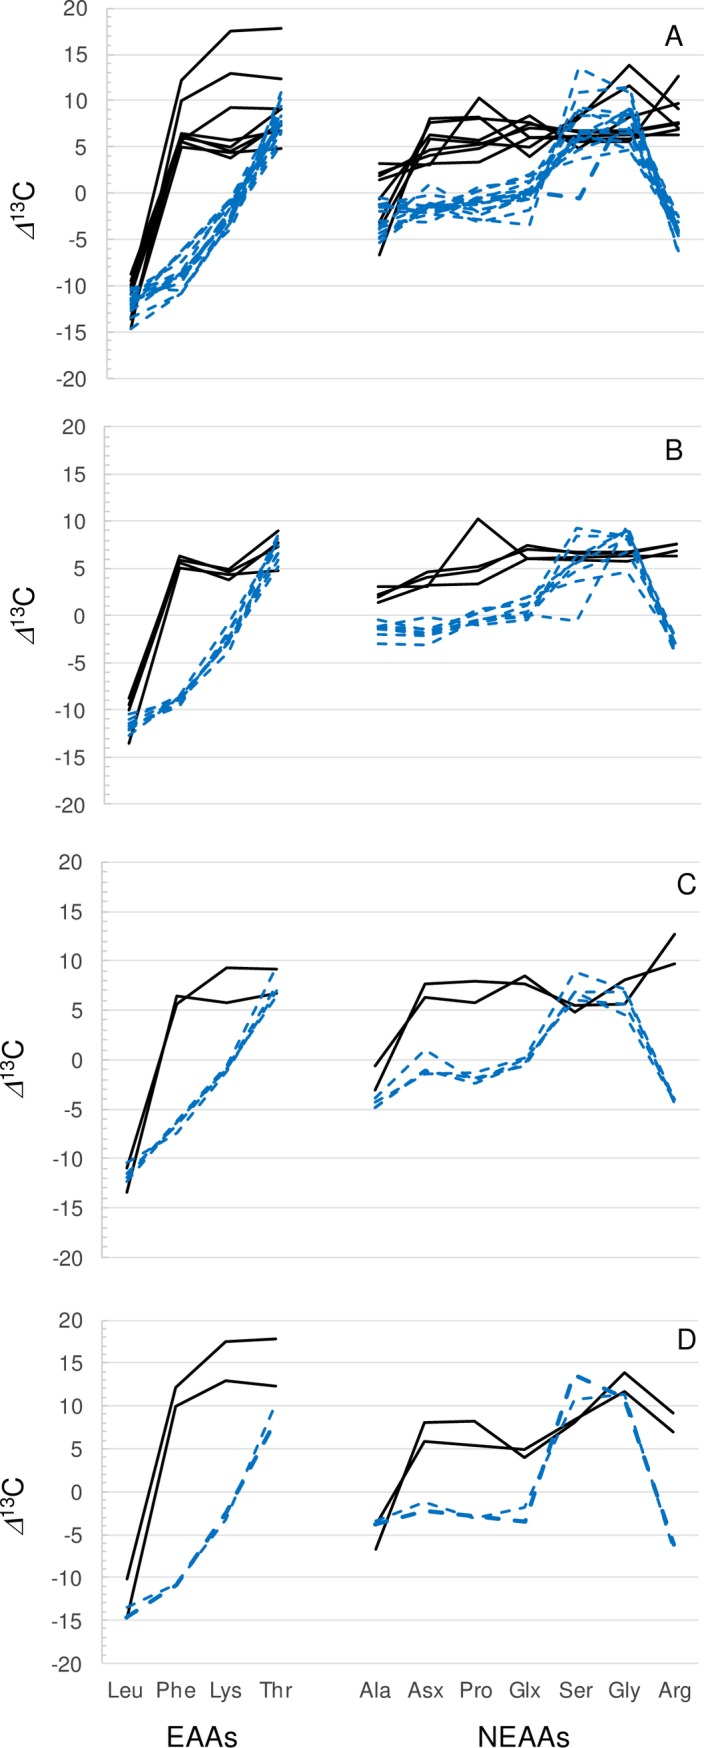
Fig 5.

A comparison of amino acid position specific δ13CCARBOXYL data from this study (solid, black lines) and compound specific δ13C data from a previous study (dashed, blue lines) [10]. Panel (A) shows data of all three taxa (humans, deer and whales), panel (B) humans, panel (C) deer and, panel (D) whales. Data are normalized to bulk carbon isotopic composition = 0‰.
