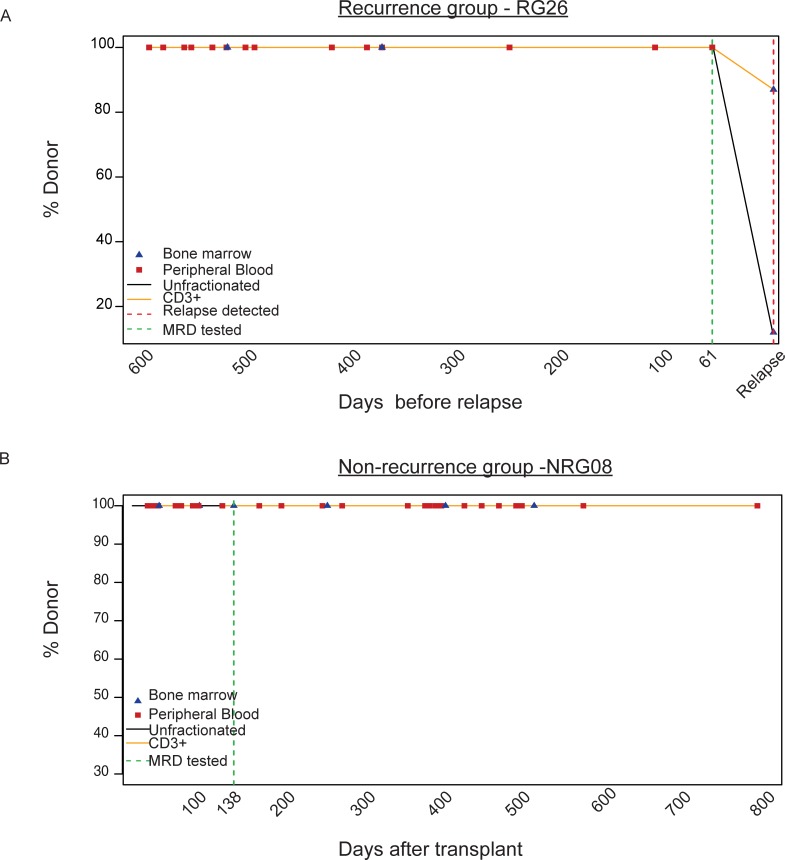
Fig 1. Retrospective AML study design.
Post-transplant engraftment analysis via short tandem repeat (STR) PCR results are plotted as % donor over time. (A) Example of longitudinal engraftment analysis from one patient in the ‘recurrence group’ (RG29) is shown here. Time is shown as days prior to relapse. Red dotted line denotes the relapse time point, while the green dotted line indicates a fully-engrafted sample within the 20–100 day pre-relapse range. (B) Example of longitudinal engraftment analysis from one patient in the non-recurrence group (NRG08) is shown here. Time is shown as days post-HCT. The green dotted line shows a fully engrafted time-point that tested for MRD, with >3 months of prior and >2 years of subsequent follow-up with full engraftment.

