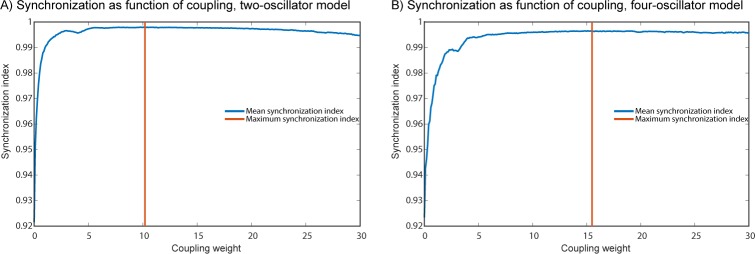
Fig 5. Synchronization as measured by the synchronization index as a function of coupling weight.
In A we see the synchronization index of the two-oscillator model as a function of coupling weight. The vertical orange line indicates the point of maximum synchronization. In B the same is shown for the four-oscillator model.

