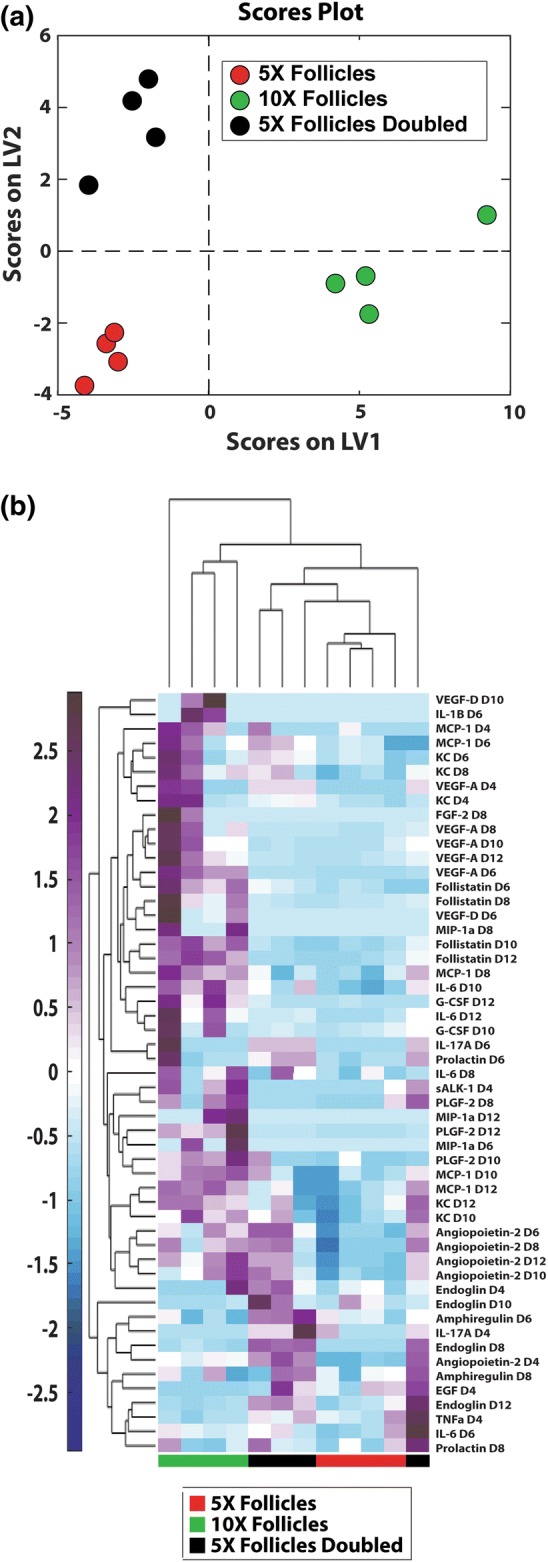
Figure 5.

Synergism between follicles in the 10× condition. Sample size: n = 4 per time point per condition. (a) Partial least square discriminant analyses on cytokines identified signatures of 10× follicles. (b) Clustered heat maps of cytokines revealed different patterns of cytokines in 10× follicles, 5× follicles and 5× follicles doubled. The normalized cytokine abundance was shown in the color bar to the left of the hierarchical cluster (purple denotes relative upregulation and blue denotes relative downregulation in relation to the mean).
