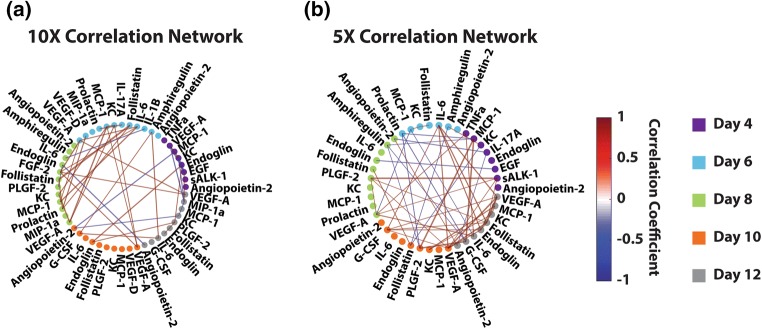
Figure 7.
Correlation maps of 10× (a) and 5× (b) conditions, suggesting earlier interaction of factors in 10× follicles, indicative of potential intervention regimes. Correlation networks were created based on only VIP-selected cytokine factors from the PLSDA model in Fig. 4 that were also above the detection limit for all samples in the respective condition. Each node (dot) represents a cytokine factor, and each edge (line connecting nodes) represents the correlation between the two nodes. Nodes are colored by day (day 4 as purple, day 6 as cyan, day 8 as green, day 10 as orange, day 12 as grey). Edge thickness represents the significance of the bivariate correlation, thicker being more significant. Edge color represents the correlation coefficient, indicating the direction of correlation (red denoting positive and blue denoting negative). All correlations with a p-value below 0.02 are not shown.

