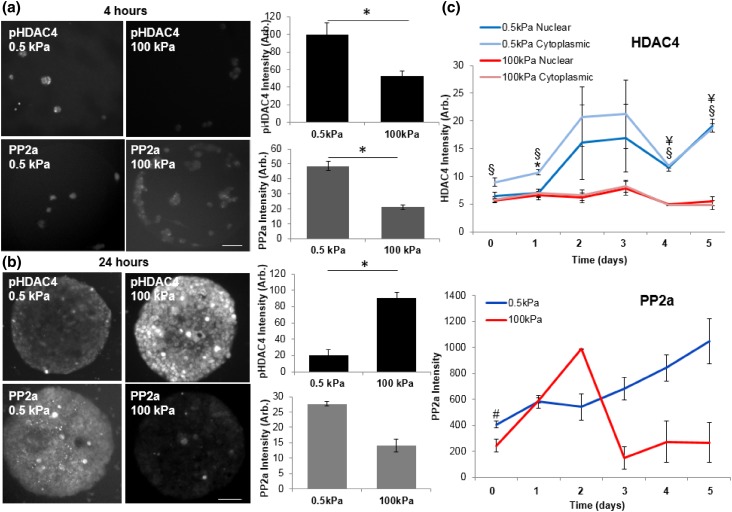
Figure 3.
The phosphostate and nuclear localization of HDAC4 on soft hydrogels is guided by phosphatase PP2a. (a) Immunofluorescence images and quantitation of pHDAC4 and PP2a 4 h after fibroblast seeding. N = 3; Error bars represent ± SEM. *p value <0.001; scale bar = 90 µm. (b) Immunofluorescence images and quantitation of pHDAC4 and PP2a 24 h after fibroblast seeding. N = 3; Error bars represent ± SEM. *p value < 0.001; scale bar = 90 µm. (c) Timecourse analysis of nuclear HDAC4 and PP2a. N = 3; Error bars represent ± SEM. *0.5 kPa cytoplasmic HDAC4 is higher than nuclear, p < 0.05. §0.5 kPa cytoplasmic HDAC4 is higher than 100 kPa cytoplasmic HDAC4, p < 0.05. ¥0.5 kPa nuclear HDAC4 is significantly higher than 100 kPa nuclear HDAC4, p < 0.05. #0.5 kPa is significantly higher than 100 kPa, p value <0.05.

