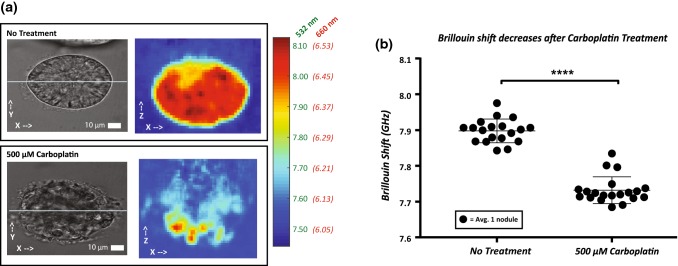
Figure 5.
(a) Brightfield images and corresponding Brillouin maps of no treatment and carboplatin treated nodules. Color bar represents Brillouin shift (GHz) represented in both 660 nm and 532 nm incident wavelengths. (b). Brillouin Shift of no treatment 500 µM carboplatin measured using Brillouin. A threshold of 7.65 GHz was used to isolate nodules from surrounding medium. The Brillouin shift was significantly lower in the 500 µM carboplatin group compared to no treatment group (p ≤ 0.0001).

