Figure 5.
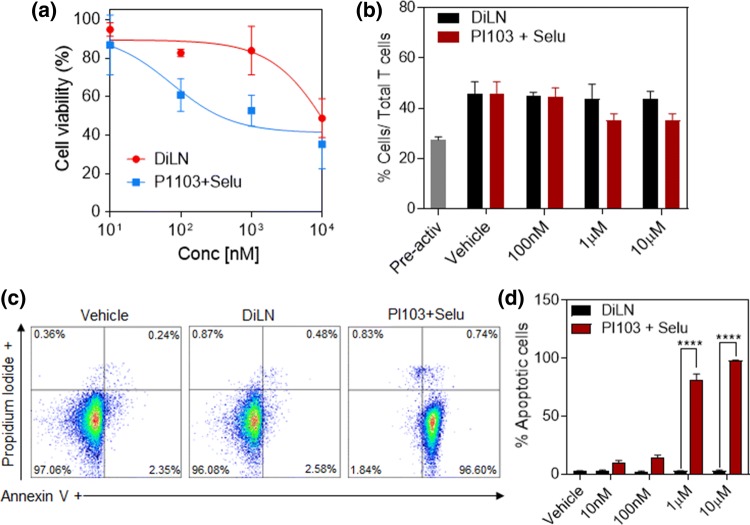
T cell cytotoxicity and function: (a) Graph shows the effect of increasing concentrations of combination PI103 and Selumetinib or DiLNs (1:1 drug ratio) on T cells after 72 h of drug treatment. (b) Graph shows the effect of increasing concentrations of PI103 and Selumetinib combined or DiLNs (1:1 drug ratio) on the activity of T cells isolated form PBMCs. T cells were activated using T cell activating CD3/CD28 Dynabeads and co-incubated with either DiLNs or PI103 and Selumetinib. The number of activated T cells (CD8+) was determined by flowcytometry. (c) Representative flow cytometry plots showing apoptosis and necrosis of T cells following treatment with increasing concentration of PI103 + Selumetinib and DiLNs (1:1 drug ratio) as measured by Annexin V Assay. T cells treated with DiLNs induced minimal apoptosis and no significant necrosis. (d) Graph shows the cytotoxic effects of increasing concentrations of either PI103 + Selumetinib or DiLNs (1:1 drug ratio) on T cells. Annexin V was used to determine the number of apoptotic cells. Statistical analysis was performed with student t-test. Data shows mean ± SEM (n = 3); ****p < 0.0001.

