Figure 6.
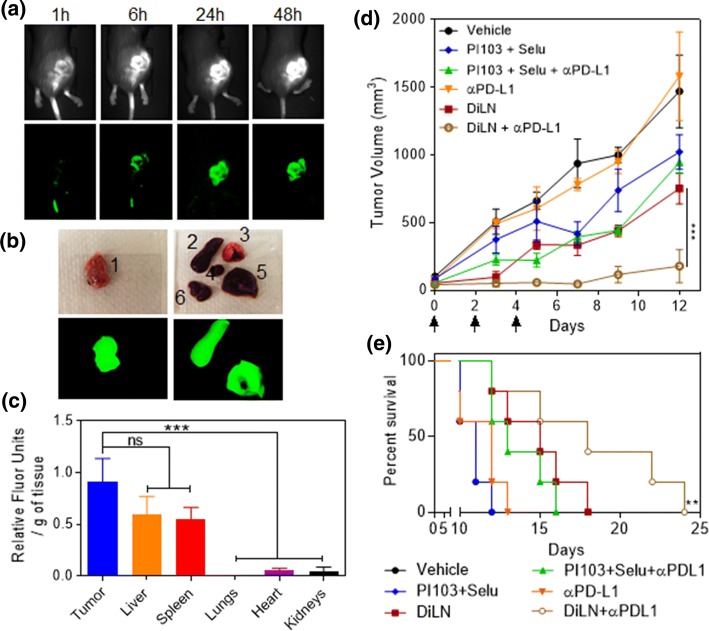
Biodistribution study of DiLNs in D4M model: (a) Representative NIR fluorescence images of D4M tumor bearing mice at different time points after NIR-dye tagged DiLNs injection. (b) Ex-vivo NIR imaging of the excised organs after 48 h. (1. Tumor, 2. Spleen, 3. Lungs, 4. Heart, 5. Liver 6. Kidneys) (c) Graph shows the quantification of the NIR-dye accumulation in different organs. Data shown are mean ± s. e. m. (n = 3). Statistical analysis was performed with One-way ANOVA with Newman-Keuls post-test. Data shows mean ± SEM (n = 3); n.s., not significant; ***p < 0.001. (d) Graph shows tumor growth profiles in D4M tumor bearing mice after different multi-dose treatments. The tumor bearing animals were injected with 3 doses of either vehicle (control), free drug combination of Selumetinib and PI103, free drug combination of Selumetinib and PI1039 + anti-PD-L1, free anti-PD-L1 antibody, DiLNs and DiLNs + anti-PD-L1 at day 0,3 and 5. (5 mg/kg equivalent dose of each drug-. Data shown are mean ± s. e. m.) (n = 5). Statistical analysis was performed with One-way ANOVA with Newman-Keuls post-test. Data shows mean ± SEM (n = 3); n.s., not significant; ***p < 0.001. (e) Kaplan–Meir survival curves show that treatment with DiLNs increases survival as compared with other treatment groups (n = 5 in each treatment group).

