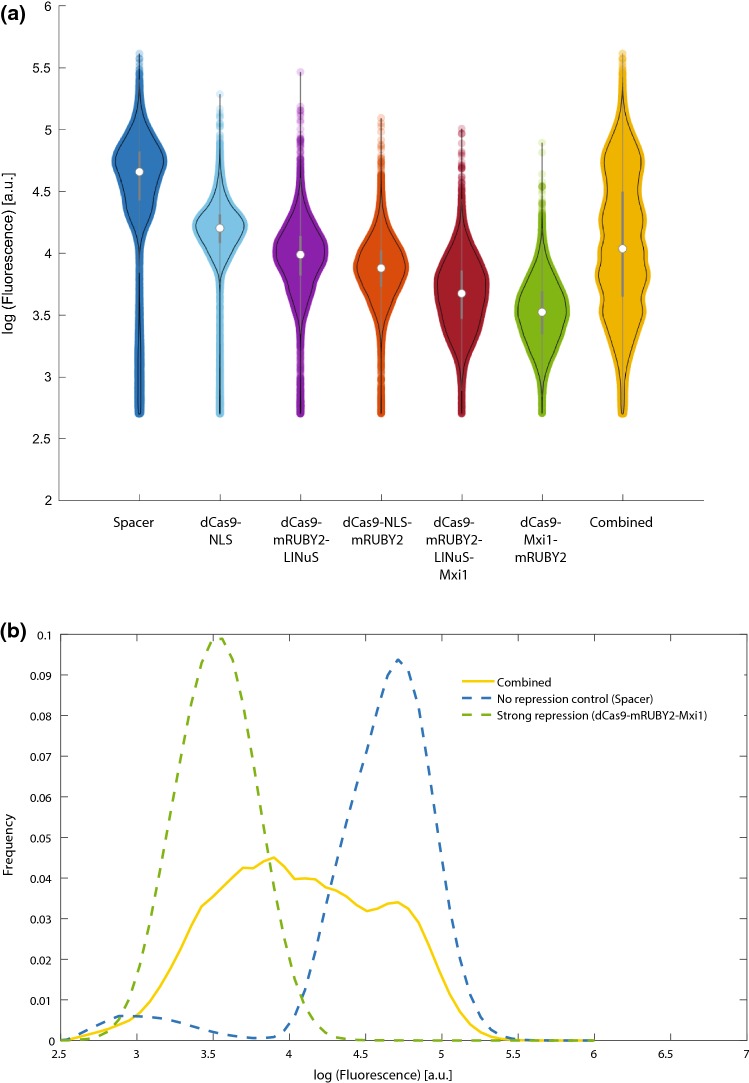
Figure 10.
(a) Basal (dark) repression of Tef1-GFP varies in the different repressor configurations. Each violin plot represents median, interquartile range, and 95% confidence interval on a representative population of cells (three biological replicates). (b) By randomly combining cells from each population, we can in silico generate a population of cells with expression varying over a 100-fold range, from the highest values to the most repressed (dCas9-Mxi1-mRuby2) values (“Combined”).

