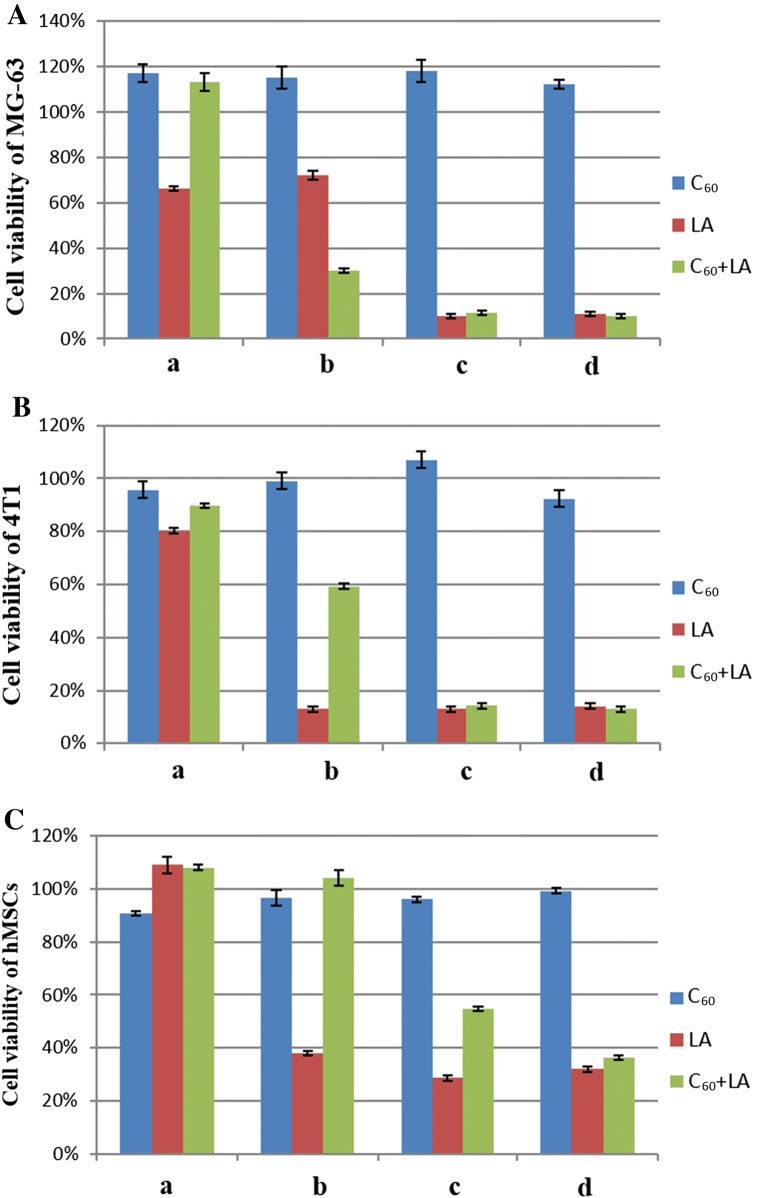
Figure 3.
MTT assay for MG-63 cells (A), 4T1 cells (B) and hMSCs (C) after 72 h of incubation with C60FAS, LA and C60 + LA mixture at different concentrations: 0.15, 0.2 and 0.15 + 0.2 μg mL−1 (a), 0.75, 1.0 and 0.75 + 1.0 μg mL−1 (b), 1.5, 2.0 and 1.5 + 2.0 μg mL−1 (c), 3.0, 4.0 and 3.0 + 4.0 μg mL−1 (d). Data are given relative to the untreated control samples (p < 0.05) and represent the mean ± SD of three independent experiments.

