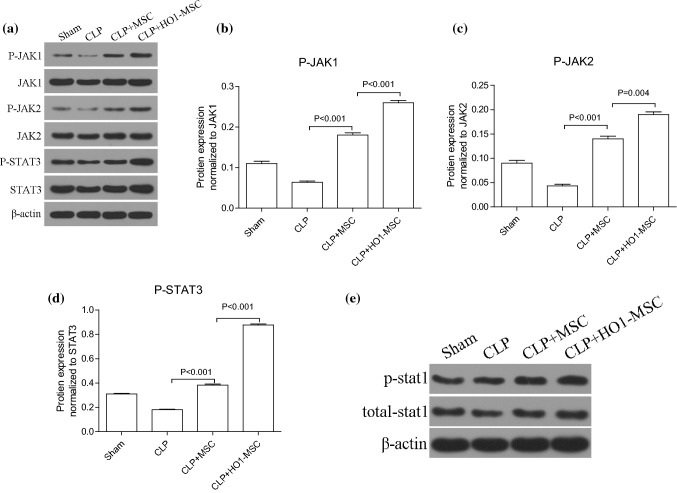
Figure 6.
HO-1 MSCs activates JAK/stat3 signaling pathway 48 h after MSC treatment. (a) Western blot image of key proteins in the JAK/stat3 signaling pathway, including JAK1, P-JAK2, JAK2, P-STAT3, STAT3. The expression of β-actin was used as a loading control. (b)–(d) Quantitative comparison of the expression levels of P-JAK1, P-JAK2, and P-STAT3 between different groups. (e) Western blot image of STAT1 and P-STAT1. p value: Student’s t test and ANOVA. Error bar: SEM.

