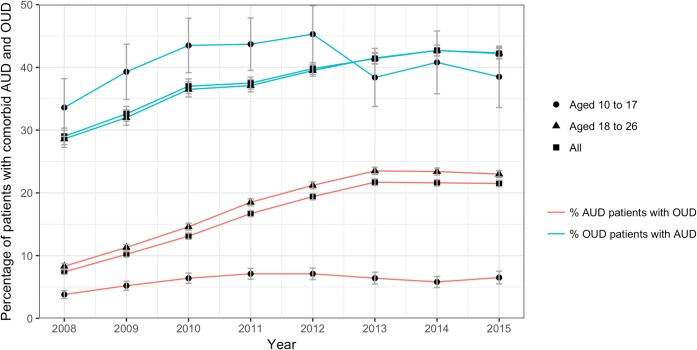
Figure 2.
Percentage of adolescent and young adult insurance plan members ages 10–26 years with dual alcohol and opioid use disorders over the 2008–2015 period in total and by age group. Red lines depict the percentage of adolescent and young adult insurance plan members ages 10–26 years who have an alcohol use disorder and who also have an opioid use disorder in total (●) and for youth ages 10–17 years (▲) and 18–26 years (■). Error bars indicate 95% confidence intervals. Green lines depict the percentage of adolescent and young adult insurance plan members ages 10–26 years with an opioid use disorder who also have an alcohol use disorder in total (●) and for youth ages 10–17 years (▲) and 18–26 years (■). Error bars indicate 95% confidence intervals. Figures 1-2 contains poor quality of text inside the artwork. Please do not re-use the file that we have rejected or attempt to increase its resolution and re-save. It is originally poor, therefore, increasing the resolution will not solve the quality problem. We suggest that you provide us the original format. We prefer replacement figures containing vector/editable objects rather than embedded images. Preferred file formats are eps, ai, tiff and pdf.Thank you. We are attaching to this email the originally submitted high quality .tiff files to be uploaded as Figures 1-2. The Figures in the proofs do look less less crisp than what was provided. Please can you use the attached Figures and see if they improve the resolution?

