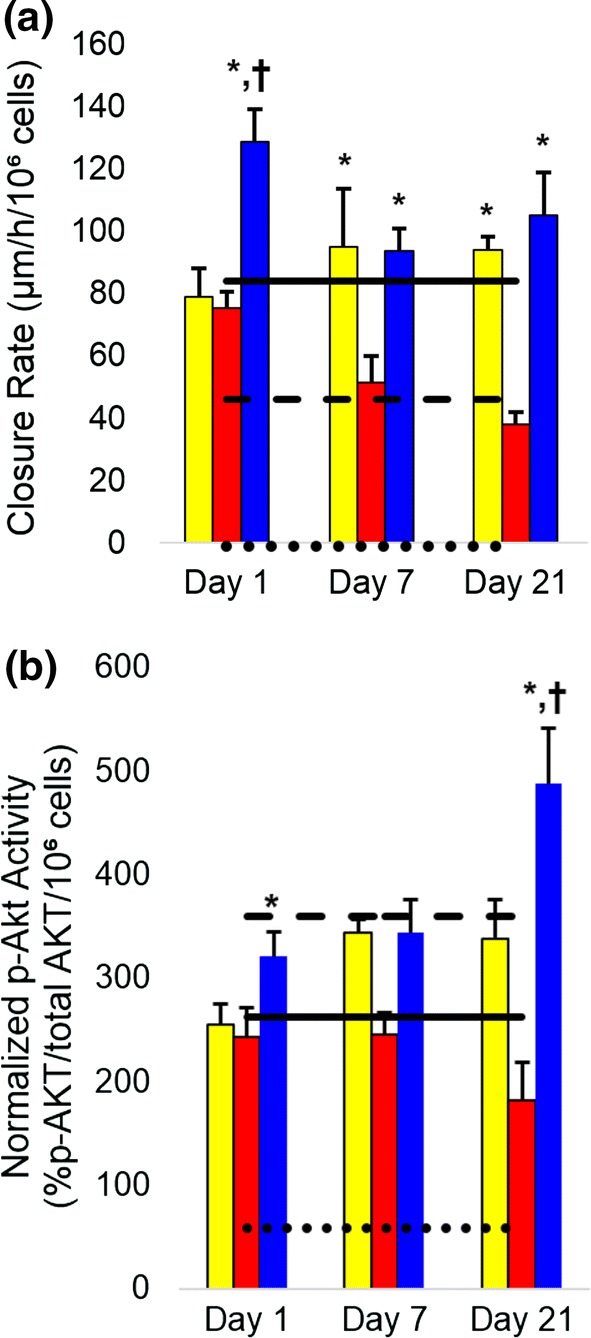
Figure 2.

Bioactivity of insulin and MSC factors. (a) The closure rate of scratches in keratinocyte monolayers; (b) Akt phosphorylation of L6 myoblasts. Dotted lines indicate empty hydrogel controls, dashed lines are ISC monolayers, and solid lines represent MSC monolayers. All groups were statistically greater than control. Asterisks indicate statistically significant increases (p < 0.05) compared to other hydrogel groups; crosses indicate significant increases (p < 0.05) compared to all groups. All cell-laden hydrogels promoted significant HaCaT migration and Akt phosphorylation compared to control. Error bars show standard error of mean. Yellow filled square MSCs, red filled square ISCs, blue filled square ISC:MSC.
