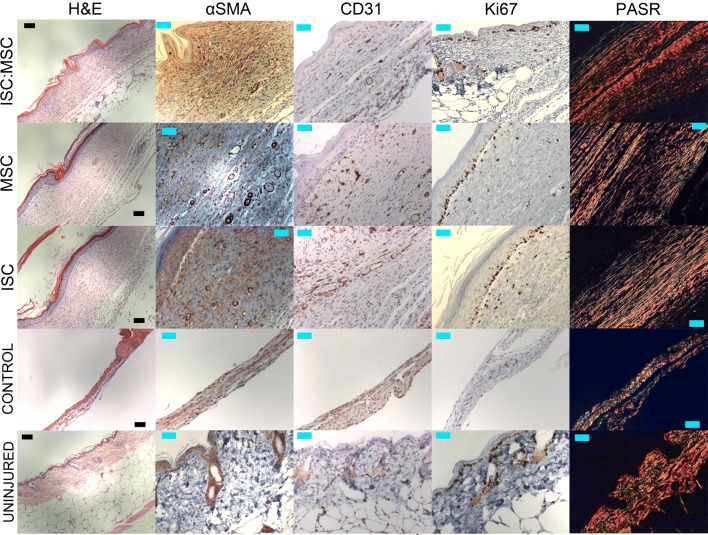
Figure 5.
Day 28 H&E, αSMA, CD31, Ki67, and PASR stained sections of treatment groups, untreated control wounds, and uninjured skin. Sections are all within healing areas. Black scale bars are 100 µm; cyan scale bars are 50 µm. Most notable features are the return of a hypodermal layer and the increased level of collagen I (PASR, orange) compared to collagen III (PASR, green) in ISC:MSC-treated skin.

