Figure 4.
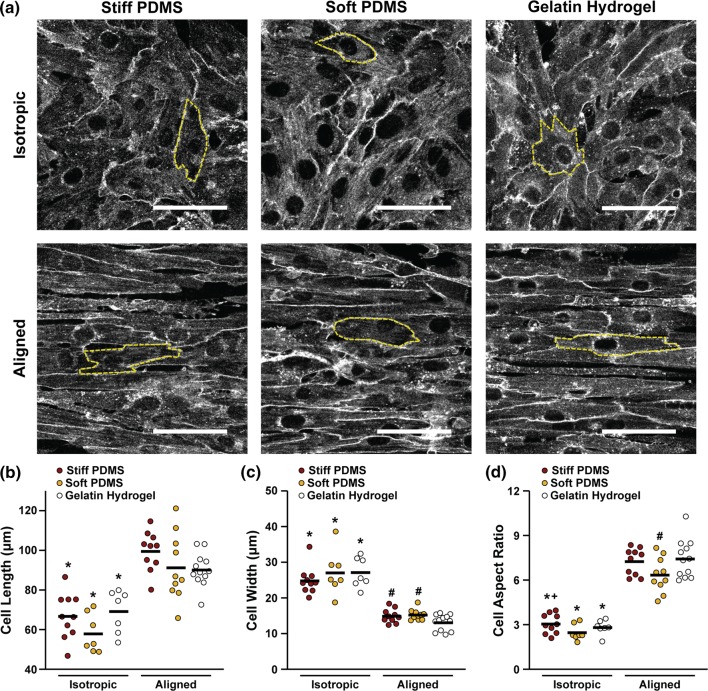
Cell Shape. (a) Representative images of di-8-ANEPPS membrane staining for cardiac tissues engineered on each substrate. Dotted yellow lines indicate individual cells used to calculate cell shape (scale bars: 50 µm). Cell length (b); width (c); and aspect ratio (d) measured from outlined cells. *p < 0.05 compared to corresponding aligned condition, +p < 0.05 compared to isotropic soft PDMS, #p < 0.05 compared to aligned gelatin hydrogel. Statistics details are provided in Supplemental Tables 3–5.

