Figure 5.
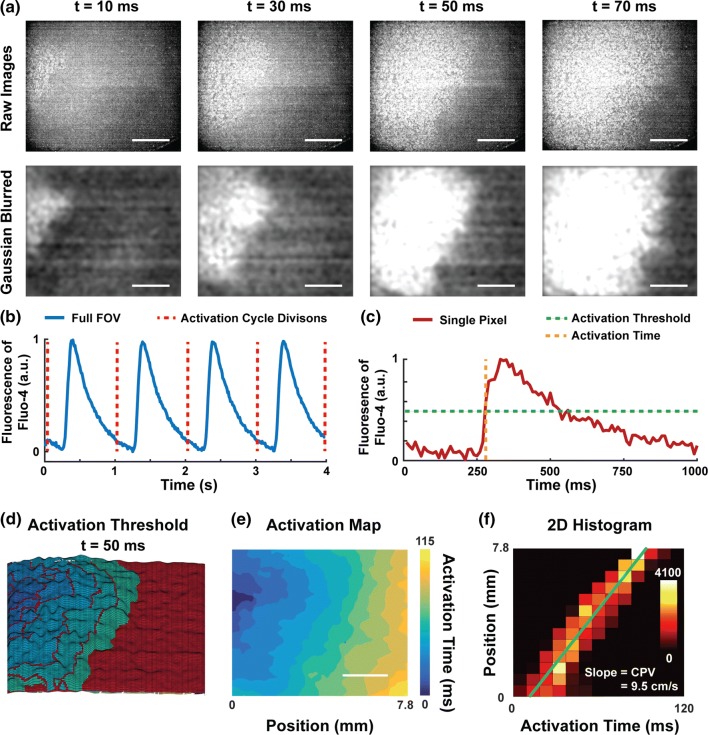
Flowchart of data processing for CPV. (a) High-speed videos of Fluo-4 calcium transients were Gaussian blurred (scale bars: 2 mm). (b) The average fluorescence signal for the full field of view (FOV) of a tissue over 4 s is shown. Automatic peak detection was used to divide the signal into activation cycles. (c) The fluorescence signal for a single pixel over one activation cycle is shown, with activation threshold and activation time indicated. (d) 3D visualization of activation thresholds and fluorescence 50 ms after initial activation. The z-height of the red surface indicates the activation threshold for each pixel. The other colors are isochrones of activation times, matching the color bar in (e). Within the isochrones, the height represents the fluorescence magnitude of that pixel at the given timepoint. (e) The activation time of each pixel is plotted to generate an activation map (scale bar: 2 mm). (f) The horizontal position of a pixel is plotted against its activation time. The color of each square corresponds to the number of pixels within that square, as indicated by the color bar. Robust linear regression is used to match a line to the data (green), with the slope indicating the CPV.

