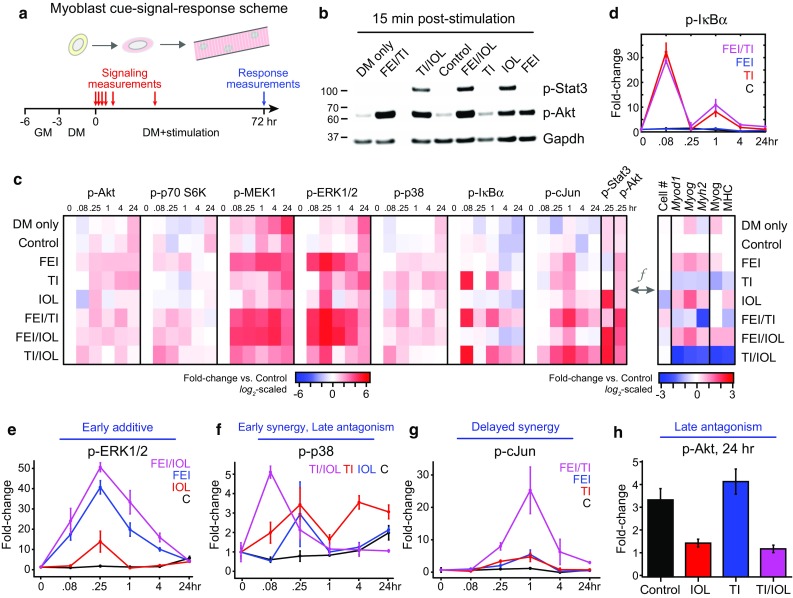
Figure 2.

Myoblast cue-signal-response data compendium identifies co-treatment synergies with variable dynamics. (a) A dense time-course of multiple phosphoprotein signals was quantified through a mixture of multiplexed Luminex and immunoblotting assays. Primary mouse myoblasts were cultured in differentiation medium (DM) with 0.1% DMSO (control) and were stimulated with either FGF2 + EGF + IGF1 (FEI), TNF-α + IL-1α (TI), IL-6 + OSM + LIF (IOL), or their two-way combinations for 72 h. Phosphoprotein measurements were quantified at 0, 5 min, 15 min, 1, 4, and 24 h and differentiation responses were quantified at 72 h post-stimulation; (b) Representative immunoblots for p-Stat3, p-Akt, and Gapdh (as a loading control); (c) Heatmap of signaling-response data compendium. Left, Mean values (from n = 3 replicates) of p-Akt, p-p70 S6 kinase, p-MEK1, p-ERK1/2, p-p38 MAP kinase, p-IκBα, and p-cJun Luminex time-courses and phospho-Stat3 and p-Akt immunoblots (15 min time-point only). Signaling data were first normalized to β-tubulin (Luminex) or Gapdh (blots) levels, then were fold-change normalized to the t = 0 Control sample and reported on a log2-scale (see Fig. S2 for full data set). Right, Mean values of proliferation and differentiation (Myod1, Myog, Myh2 by RT-qPCR; Myog, MHC by quantitative immunoblot) responses (from Fig. 1) normalized to the Control sample and reported on a log2-scale; (d) p-IκBα time-course for control, TI, FEI, and FEI + TI conditions demonstrating biphasic activation peaks; (e) Phospho-ERK1/2 time-course for Control, IOL, FEI, and FEI + IOL conditions; (f) Phospho-p38 time-course for Control, TI, IOL, and TI + IOL conditions; (g) p-cJun time-course for Control, TI, FEI, and FEI + TI conditions; (h) p-Akt at 24 h for Control, TI, IOL, and TI + IOL conditions. In (d–h), n = 3 replicates are plotted as mean ± SEM.
