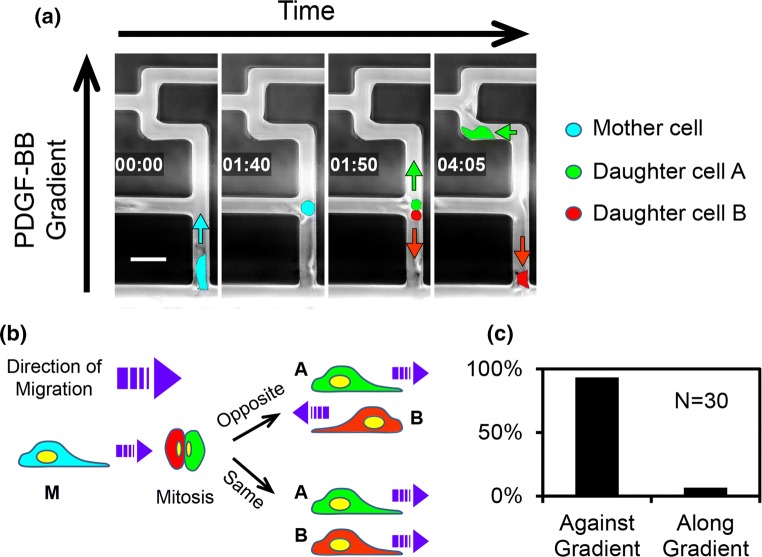
Figure 6.
(a) Time-lapsed montage of cells undergoing mitosis when migrating in the maze. The cells were false-colored for visual recognition. Cyan, red, and green arrows show the direction of migration of the mother and the two daughter cells, respectively. The time is displayed as hh:mm. The scale bar is 50 µm. (b) Diagram showing two directional scenarios encountered by the two daughter cells. (c) Frequency of occurrence of the two directional scenarios shown in panel (b).

