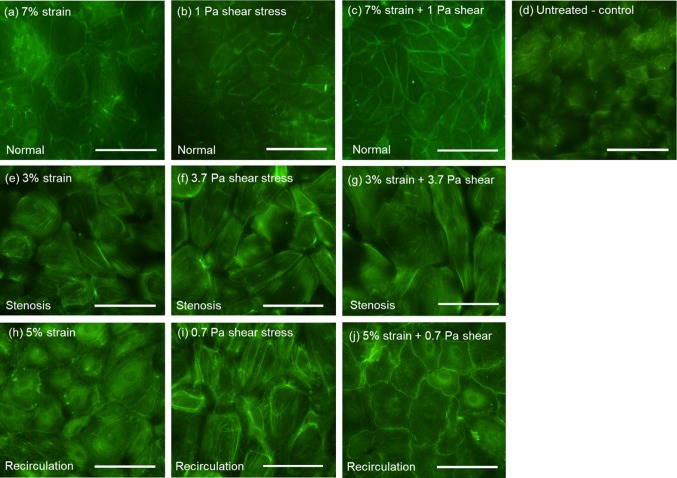
Figure 3.
Representative images of EC following shear stress and tensile strain treatment. Untreated EC (panel d) were used as the experimental control. Scale bars represent 50 μm. (a) EC under normal tensile strain (7%); (b) EC under normal shear stress (1 Pa); (c) EC under normal/physiological tensile strain (7%) and shear stress (1 Pa); (d) untreated EC; (e) EC under pathological low tensile strain (3%); (f) EC under elevated shear stress (3.7 Pa); (g) EC under low tensile strain (3%) and elevated shear stress (3.7 Pa; stenosis condition); (h) EC under slightly reduced tensile strain (5%); (i) EC under pathological low shear stress (0.7 Pa); (j) EC under low tensile strain (5%) and low shear stress (0.7 Pa; recirculation condition). Cell cytoskeleton F-actin filaments were detected by Alexa Fluor 488-conjugated phalloidin.

