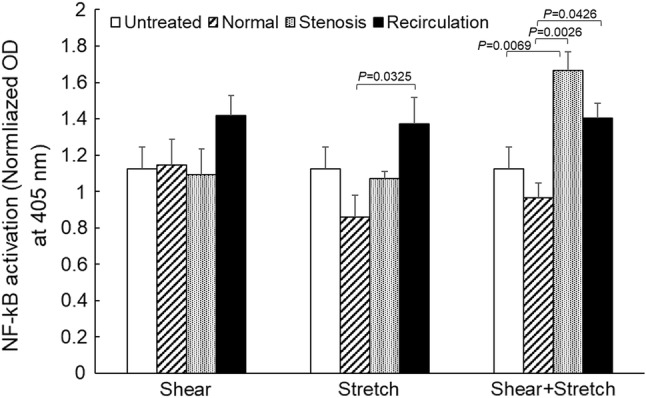
Figure 8.

Transcription factor NF-κB activation following shear stress and/or tensile strain treatment. Data is presented as mean + standard error (n = 3–11). All O.D. values were normalized by the total protein concentration. Significant differences (p < 0.05, by two-way ANOVA) within each treatment group are marked.
