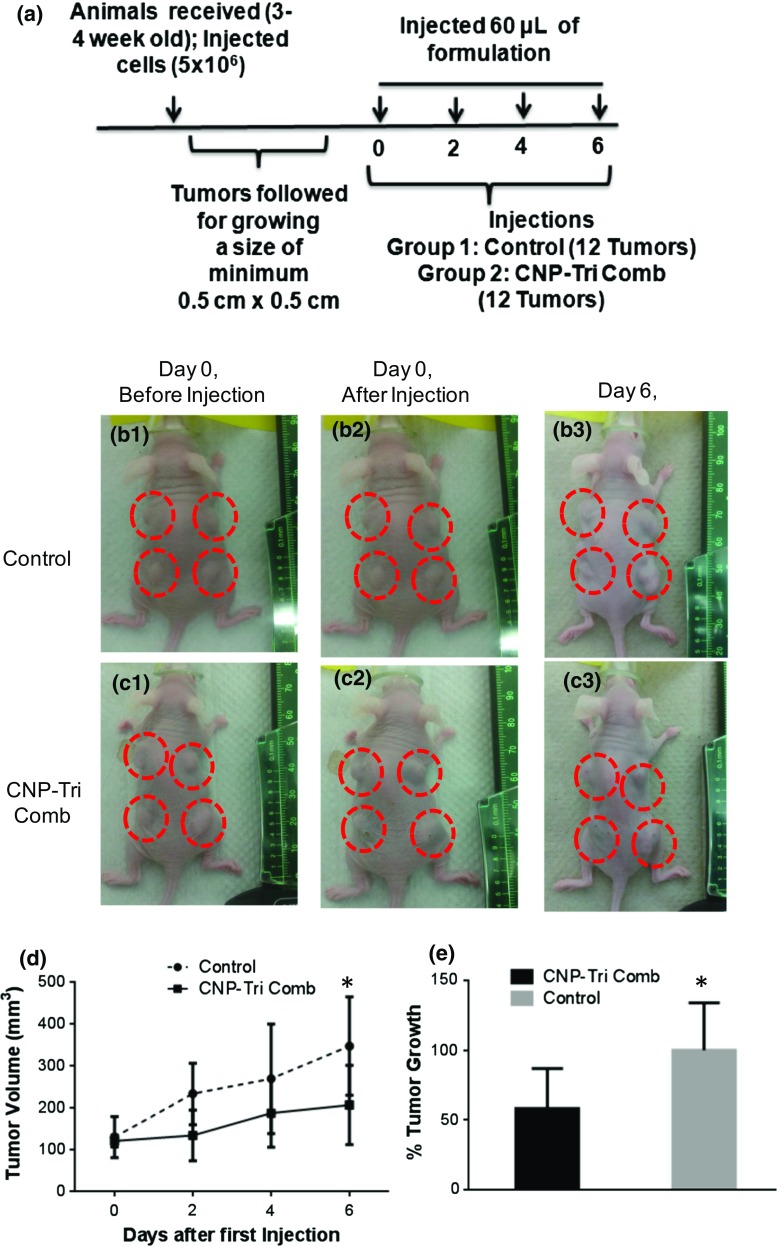
Figure 9.
In vivo results on xenograft mouse model. (a) Timeline of experiment; (b, c) representative animals with tumors before and after treatment with (b) DPBS; (c) CNP-Tri Comb. B1 and C1 represent animals with tumors before injections and B2 and C2 after injections while smaller size of tumors were seen in C3 compared to B3 at 6th day of measurement. (d) Tumor growth curves with time and (e) fold changes after treatment with buffer (control) and CNP-Tri Comb. * represent the p < 0.05 and a bio-statistically significant difference in tumor size treated with CNP-Tri Comb compared to buffer control as obtained after performed t test.

