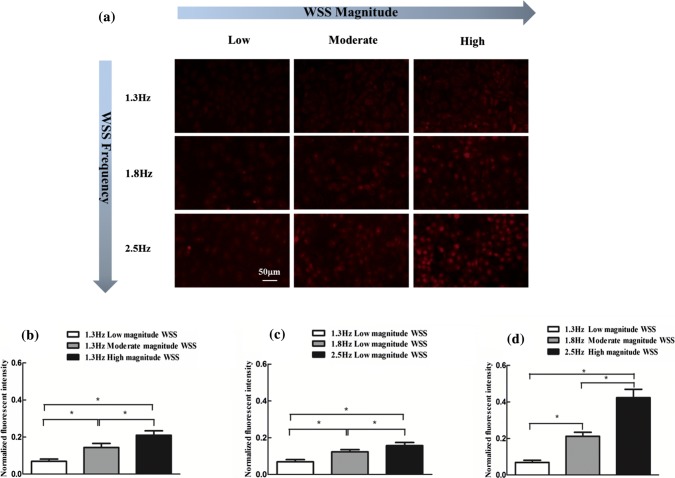
Figure 4.
ROS production respond to WSS with frequency or/and magnitude increase for 2 h. (a) Representative fluorescence images of intracellular ROS. (b) ROS production with the increase of magnitude of WSS at fixed frequency. (c) ROS production with the increase of frequency of WSS at fixed magnitude. (d) ROS production with the both increase in frequency and magnitude of WSS. n = 3 per group. *p < 0.05.

