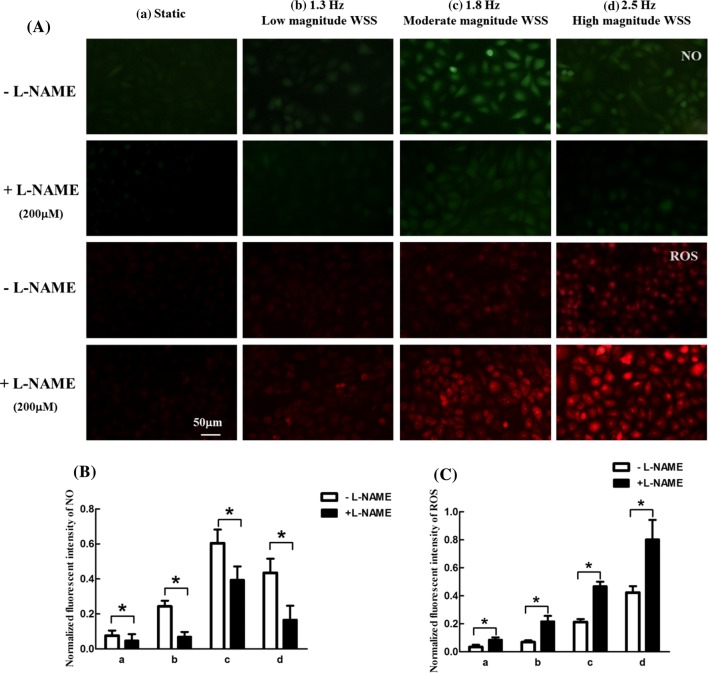
Figure 7.
Effects of L-NAME on NO and ROS generation in endothelial cells exposed to different WSS conditions for 2 h. (A) Representative fluorescence images of intracellular NO and ROS.(B) Normalized fluorescent intensity of NO. (C) Normalized fluorescent intensity of ROS. (a) Static, (b) 1.3 Hz and low magnitude WSS, (c) 1.8 Hz and moderate magnitude WSS, (d) 2.5 Hz and high magnitude WSS. n = 3 per group. *p < 0.05.

