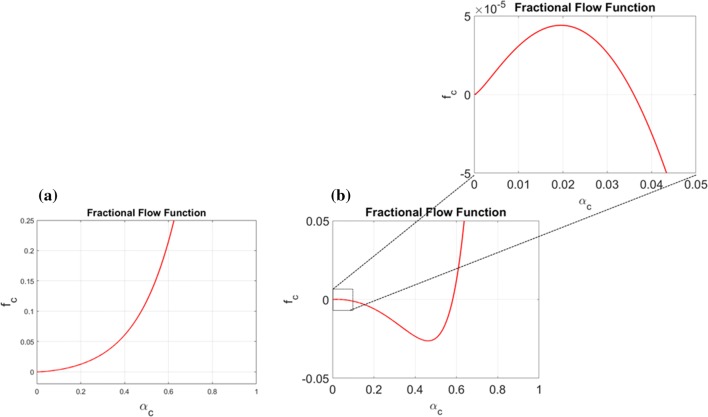
Figure 11.
(a) Plot showing for the choice (11) with parameters as given in (14) and (15) except that instead of signaling a reduced tissue conductivity. This change in fluid–ECM resistance force implies that the net effect of the fluid–ECM, cell–ECM, and cell–fluid interactions as expressed by , , and (where the two latter are unchanged) removes the negative part of the fractional flow function . On, the other hand, a 20 fold reduction in conductivity also gives a corresponding reduction in total velocity such that the net effect on is adjusted correspondingly. (b) Plot showing for the choice (11) with parameters as given in (14) and (15) except that and . This adjustment of the cell–fluid interaction effect through is sufficient to maintain a net upstream cell migration through the cell velocity component . Zoomed version reveals a positive part reflecting downstream fluid–stress generated migration through for very small ().

