Figure 3.
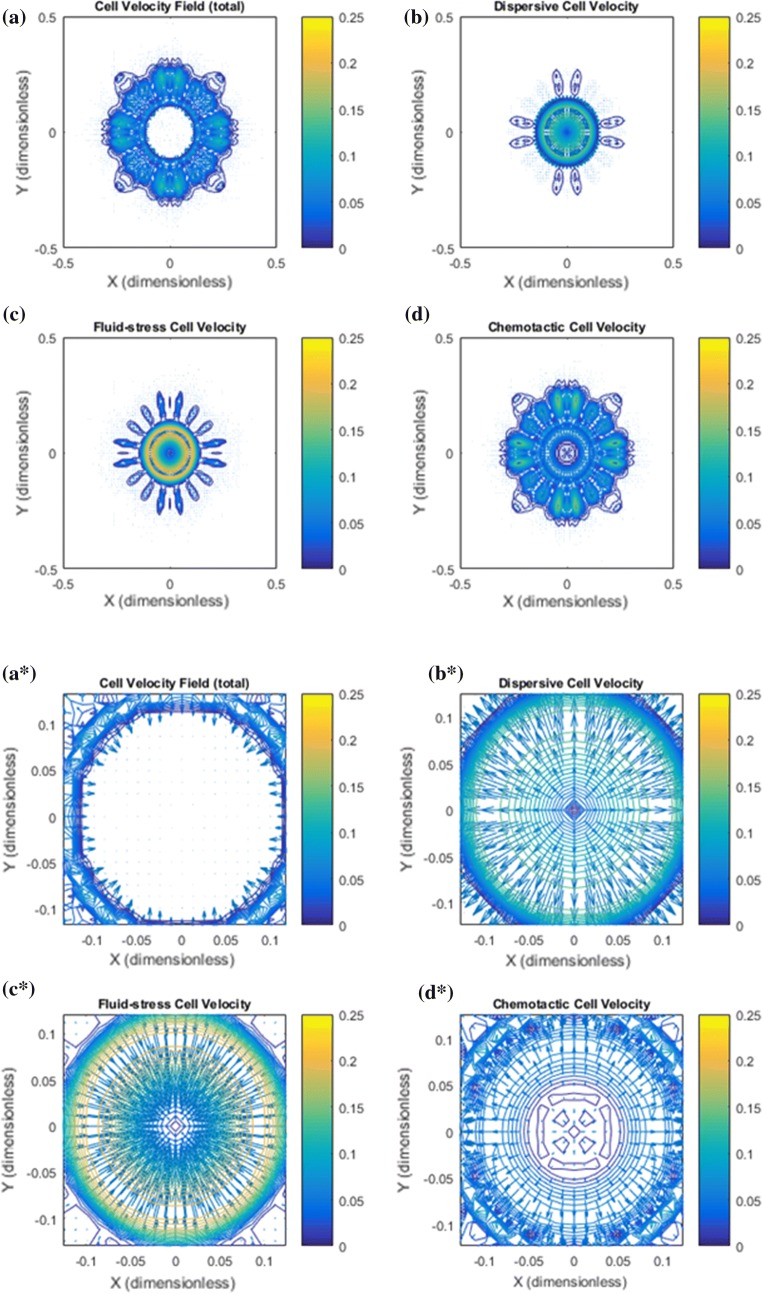
Base case: Illustration of the cell velocity components corresponding to the tumor cell migration shown in Fig. 2. Note that the dimensionless cell velocity has been been multiplied by 100 such that 0.25 amounts to 0.0025 . (a) shows the net cell velocity field given by (7). (b) The dispersive velocity component given by (9). (c) The fluid–stress generated cell velocity field given by (8). (d) The chemotactic cell velocity component given by (10). (a*) Zoomed version of (a). At the rim of the tumor there is dominating tumor cell migration inwardly directed against the fluid flow direction whereas there is no migration deeper into the tumor. (b*) Zoomed version of (b). An outwardly directed migration represented by is seen. (c*) Zoomed version of (c). Illustrates a dominant inwardly directed effect from . (d*) Zoomed version of (d). Illustrates that represents outward cell migration in the central part of the tumor which essentially is canceled by the velocity component in light of (a*)

