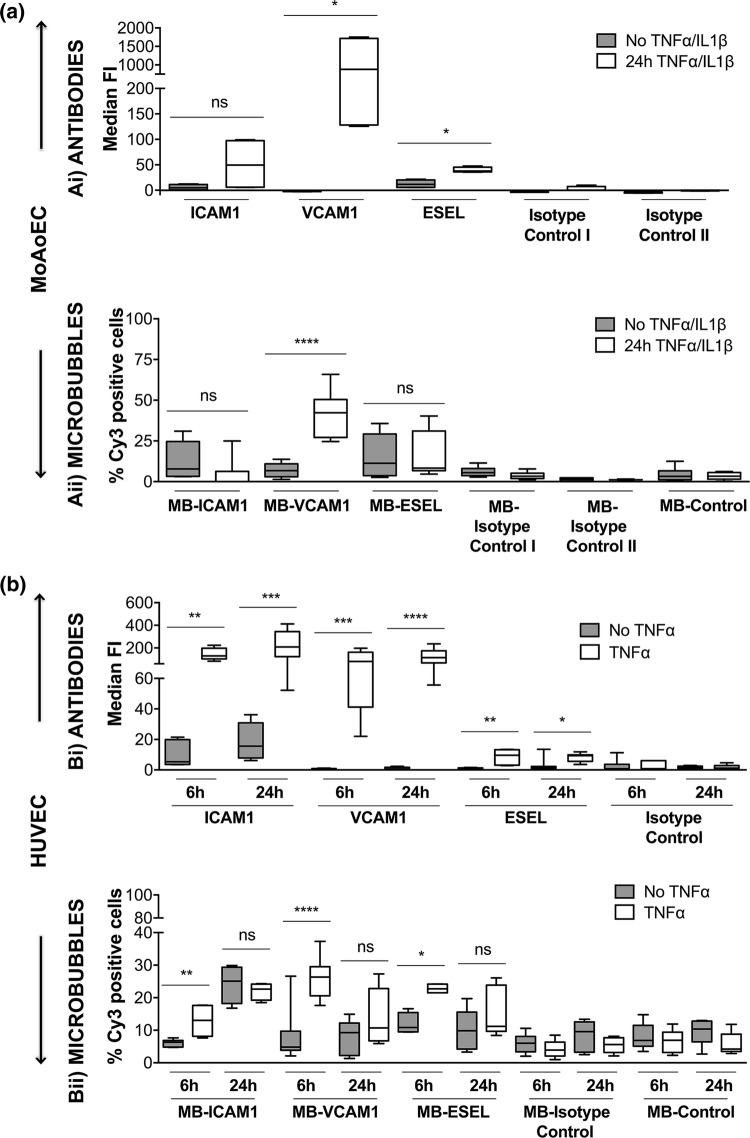
Figure 2.
Targeting of surface adhesion molecules. Pooled flow cytometry data for (a) MoAoECs and (b) HUVECs, comparing non-treated and cytokine-treated cells. Antibody binding (i) was measured as median fluorescent intensity (MFI), and binding of antibody-labeled MBs (Cy3) (ii) was measured as % positive cells. Graphs are presented as box plots with median and interquartile range; whiskers represent minimum and maximum. Statistical significance was analyzed with Mann–Whitney U *p < 0.05 **p < 0.01 ***p < 0.001, ****p < 0.0001, ns non-significant. All targeted antibodies except anti-mouse ICAM-1 had significantly higher MFI than the relevant isotype controls (ai) PE–hamster IgG1κ (ns), PE–rat IgG2aκ (p < 0.05); (bi) FITC–mouse IgG1κ (p < 0.05–0.0001); and MB controls; MB-streptavidin (p < 0.05–0.0001) and MB-isotype controls (aii) biotin hamster IgG1κ (p < 0.05) and biotin rat IgG2aκ (p < 0.01–0.0001); (bii) biotin mouse IgG1κ (p < 0.05–0.0001) for all time points. Abbreviations: E-selectin (ESEL), isotype control I (hamster IgG1κ), isotype control II (rat IgG2aκ).

