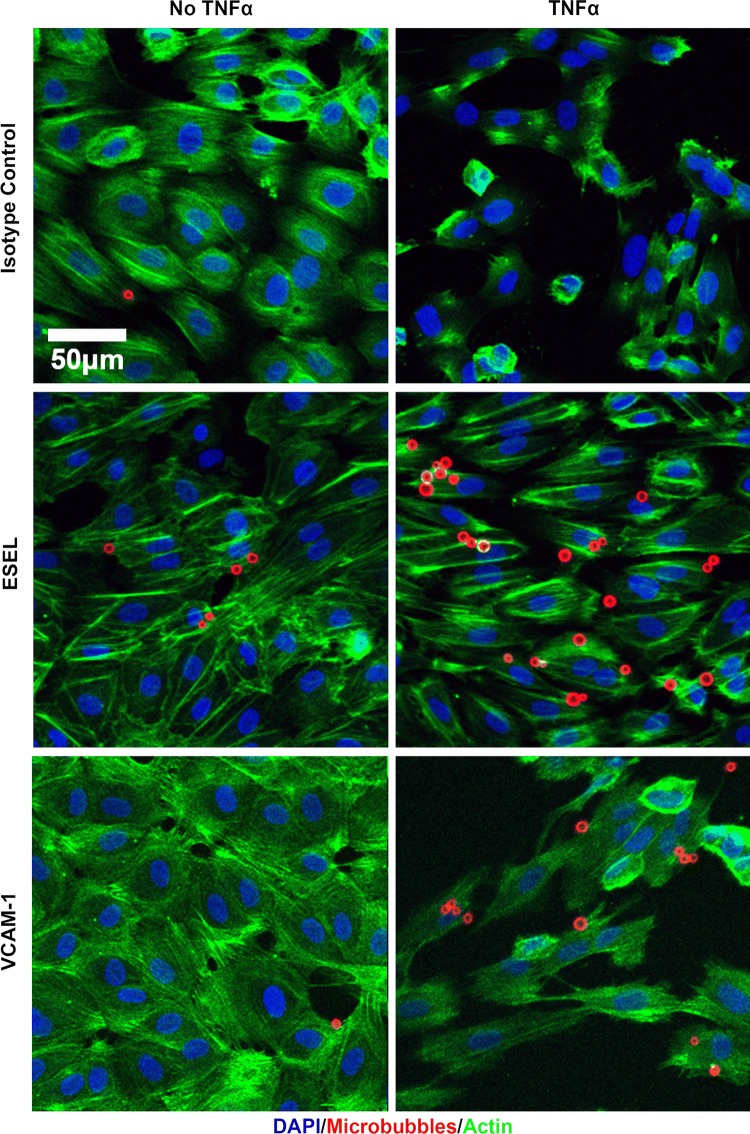
Figure 6.
Maximum intensity projections of confocal laser scanning microscopy Z-stack images showing VCAM-1- and E-selectin (ESEL)-targeted MBs adhered to TNF-α-treated HUVECs compared with untreated cells and non-targeted isotype control-MBs (mouse IgG1κ). Images were acquired after 2 min continuous flow at 2 dyn cm−2 followed by wash and a 20 dyn cm−2 pulse. Blue staining represents DAPI staining of cell nuclei; red represents Cy3 antibody-labeled MBs; green represents Alexa Fluor 488-phalloidin staining of actin.

