Figure 7.
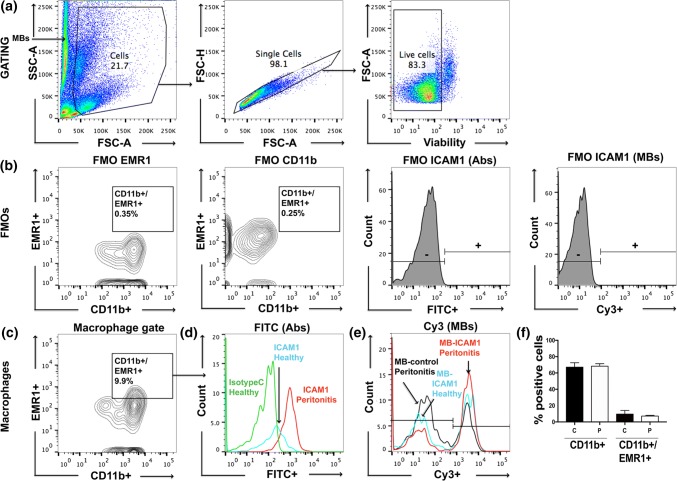
Flow cytometry data showing ICAM-1-MB targeting to peritoneal macrophages isolated from healthy control rats and rats with Zymosan-induced peritonitis. (a) Gating strategy for isolated peritoneal macrophages, (b) fluorescence minus one (FMO) controls, and (c) gating on CD11b + EMR1 + macrophages. Results are shown as histograms of (d) ICAM-1 targeted with fluorescent antibodies, or (e) antibody-labeled ICAM-1-MBs compared with control cells and non-targeted MBs. Green histogram: isotype control (FITC-mouse IgG1κ); black histogram: MB-control (Cy3 MB-streptavidin). Isolated macrophages from healthy rats (blue and green histograms) and peritonitis rats (red and black histograms). Cell counts in D and E were equal for each graph. Bar graph (f) shows the cell population of CD11b + and double positive cells (CD11b + EMR1 +) in healthy (c) and peritonitis (P) rats. Sample size n = 3 per group.

