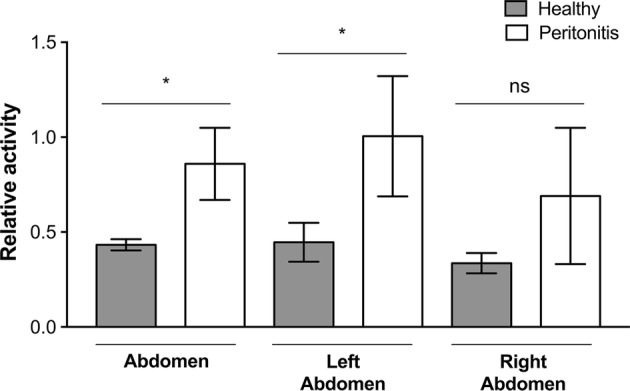
Figure 8.

SPECT-signals from inflamed and healthy control rats infused with 99mTc-labeled anti-ICAM-1-MB: Bar plot of the mean normalized relative activities (NRA) in the abdominal area in control (n = 3) vs. inflamed peritonitis (n = 4) rats; whiskers represent standard deviation. Comparison of healthy and inflamed animals: abdomen p = 0.0188, left abdomen p = 0.0323; right abdomen p = 0.1418. Significance of differences between the inflamed and control groups was analyzed using an unpaired t-test with Welch’s correction *p < 0.05. No significant differences were observed between left and right sides of the abdomen within each individual: inflamed animals p = 0.3121, healthy animals p = 0.1902. Statistical analysis with paired t-test with Welch’s correction *p < 0.05.
