
Figure 4.
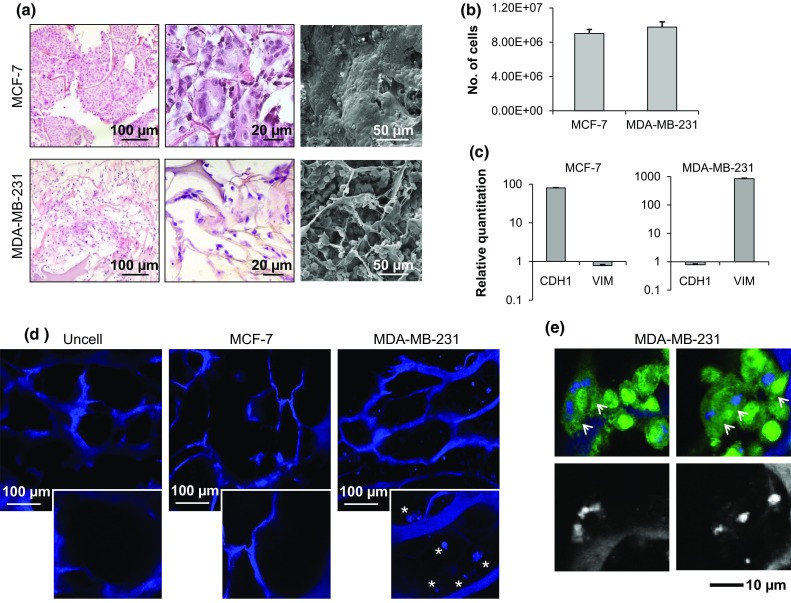
(a) Hematoxylin & eosin staining of paraffin-embedded sections of the 3D scaffolds cultured with MCF-7 or MDA-MB-231, and SEM imaging of scaffolds cultured with MCF-7 or MDA-MB-231; (b) number of MCF-7 and MDA-MB-231 infiltrating the scaffold on day 10; (c) relative quantitation values of E-cadherin (CDH1) and vimentin (VIM) in MCF-7 and MDA-MB-231 cells; (d) confocal images of the collagen matrix (blue, autofluorescence) of an empty scaffold (uncell) and of scaffolds cellularized with MCF-7 or MDA-MB-231; (e) confocal microscopy analysis of GFP-labeled MDA-MB-231 (green, GFP) on collagen scaffolds (blue, autofluorescence) and processed images to exclude the cell signal. Data are mean ± standard error (SE).