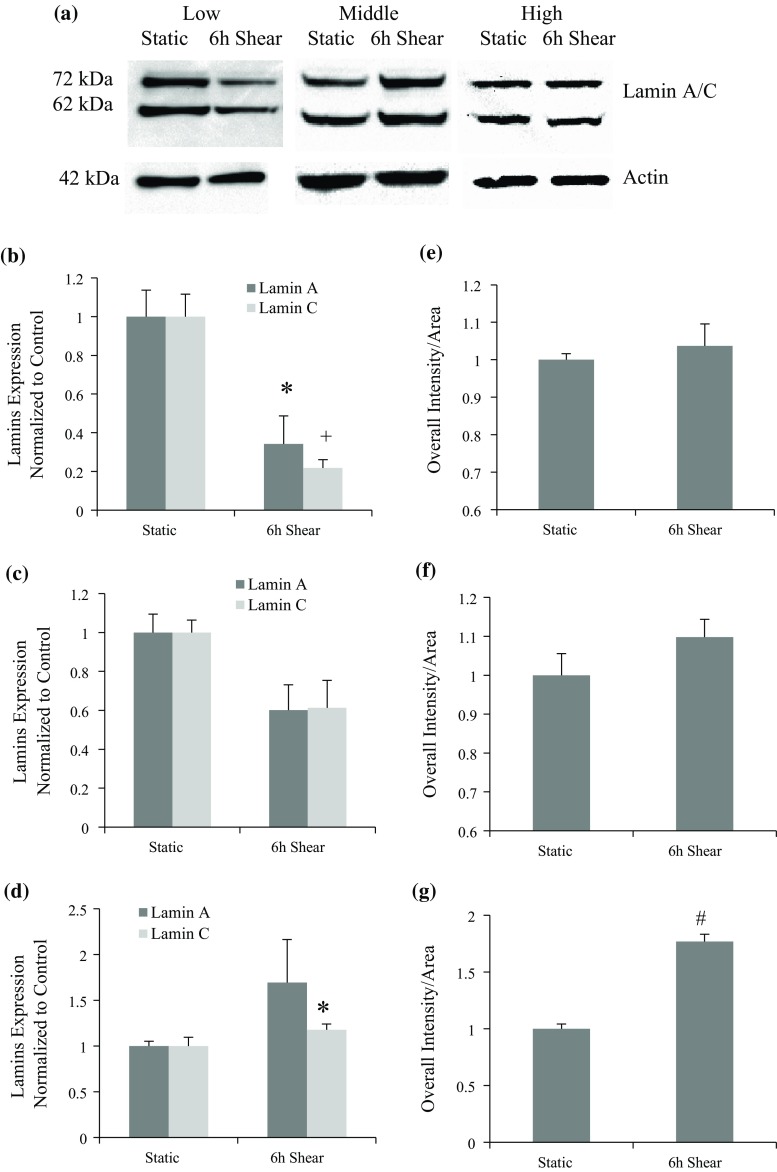
Figure 4.
Lamin A/C protein expression after 6-h shear in cells at different PDL levels. (a) Representative blot images of lamin A/C and actin before and after applying laminar shear in groups with varied PDL. (b) Lamin A/C protein expression after 6-h shear in low PDL group, which shows significant decreases compared to control sample (*p < 0.05 for lamin A and + p < 0.01 for lamin C). (c) Lamin A/C protein expression after 6-h shear in middle PDL cells, and no significant difference was observed. (d) Lamin A/C protein expression after 6-h shear in high PDL cells, which shows significant increase for lamin C compared to control sample (*p < 0.05). (e, f, g) Mean intensity of lamin A/C within the nucleus before and after shear for three groups: low, middle, and high PDL cells, respectively. Cells were stained with lamin A/C antibody either in static condition or after 6-h shear, and results show changes with respect to static control. Significant increase was observed in high PDL cells after shear (# p < 0.001 compared with static group).

