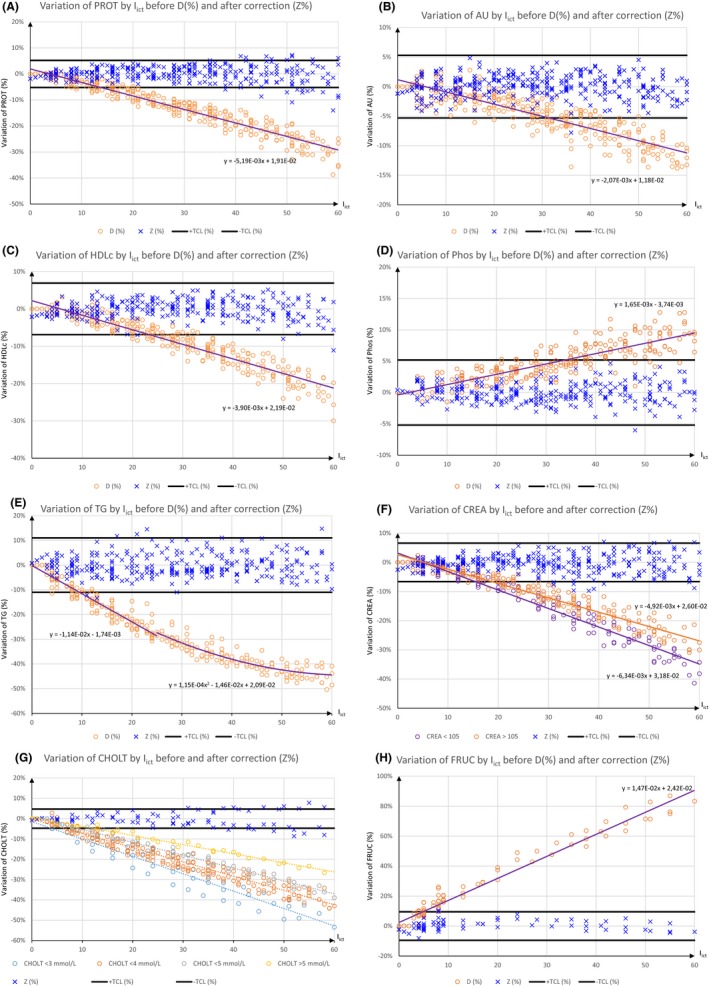
Figure 2.

Relation between I ict and analytes. Observed variation before D (%) and after correction Z (%), allowable cut‐off as ±TCL (%) and equations between I ict and D (%) are shown for PROT (A), AU (B), Phos (C), HDLc (D),TG (E), CREA (F), CHOLT (G) and FRUC (H). CHOLT is subdivided from <3 mmol/L to >5 mmol/L. The interference with CHOLT depends on level of this analyte. For CHOL (G), Z (%) is valid only when CHOLT >4 mmol/L and I ict≤40. In this last case (G), equation is 8.38 × 10⁻³ − 5.41 × 10⁻³x (see abbreviation in text)
