
Figure 3.
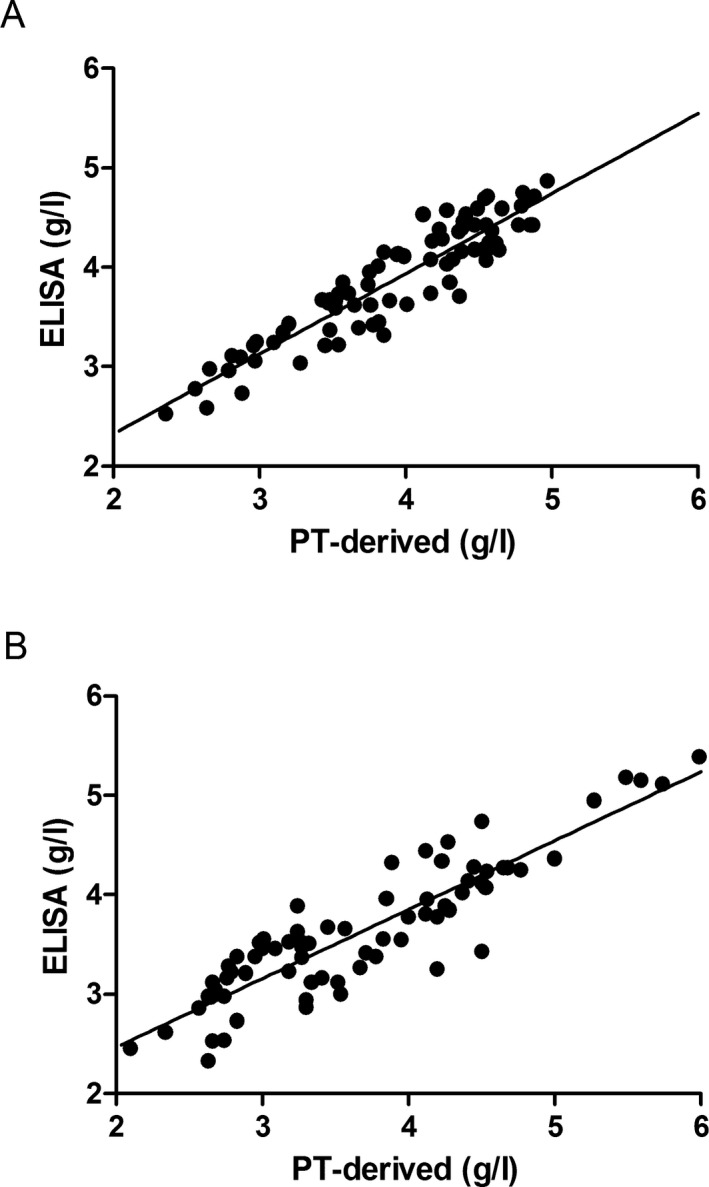
Scatterplot of fibrinogen concentrations measured by the PT‐derived method and ELISA in normal controls (A) and in patients with congenital dysfibrinogenemia (B)
Official websites use .gov
A
.gov website belongs to an official
government organization in the United States.
Secure .gov websites use HTTPS
A lock (
) or https:// means you've safely
connected to the .gov website. Share sensitive
information only on official, secure websites.
Scatterplot of fibrinogen concentrations measured by the PT‐derived method and ELISA in normal controls (A) and in patients with congenital dysfibrinogenemia (B)